VizZy
Everyone knows that ‘a picture is worth a thousand words’. Dynamic Anomaly and Pattern Response (DAPR) tools, such as Z/Yen’s PropheZy, give organisations the ability to discern and act on patterns or anomalies in complex situations to turn predictions into results. Customers of PropheZy asked Z/Yen to add graphical enhancements, resulting in VizZy, PropheZy’s visualisation suite. Visualisation helps to make sense of large complex data sets. VizZy allows the simultaneous display of actual data and predicted data in a spreadsheet-style layout with four types of diagram:
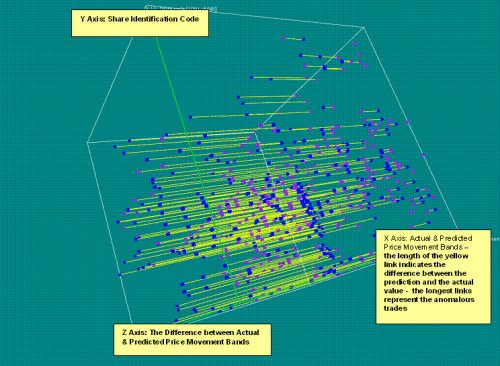
- 3D data-maps – actual and predicted data with ‘dumbell’ links;
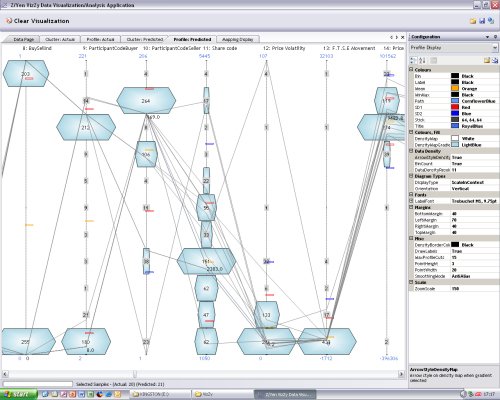
- Profile screens – of actual and predicted data;
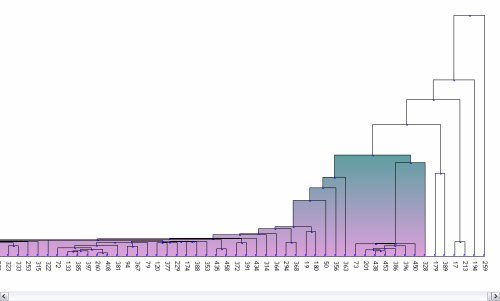
- Cluster screens – again actual and predicted data;
- Voronoi diagrams.
VizZy’s 3D data-maps provide a very insightful view of the output of PropheZy. Actual and predicted values are shown in different colours and can be linked (here the links are in yellow). The length of each link shows the difference between the prediction and the actual value.
VizZy’s profile diagrams illustrate how the properties of selected records in a data set compare with the properties of the whole set.
VizZy’s clustering diagrams illustrate how the most similar records are linked towards the bottom of the diagram. This diagram is particularly good at identifying ‘outliers’ as these are shown at the far right of the diagram.
VizZy’s Voronoi diagrams divide the space into ‘areas of influence’ – these indicate the degree of influence particular data points have on a prediction.

VizZy was designed for use with Z/Yen’s prediction engine PropheZy - a suite of statistical software that classifies, models and predicts events. Z/Yen uses PropheZy to help organisations prosper by making better choices. Z/Yen has built a number of predictive systems, e.g. Best Execution Compliance Automation, a financial markets risk estimator, health forecasting, a marketing event attendance predictor, a weather risk calculator and an advertising revenue forecaster. The predictive systems are referred to as Dynamic, Anomaly & Pattern Response (DAPR):
- Dynamic – it initiates an action and operates in near real-time;
- Anomaly – it identifies unusual or anomalous events;
- Pattern – it reinforces successful patterns;
- Response – it is adaptive as it moves with the data.
More Information: