Benchmarking University Technology Transfer
Z/Yen proposes to work with a group of universities to agree a set of metrics that would allow an institution to identify its relative performance in technology transfer. Knowing their own level of performance would give universities the ability to adjust their processes to improve performance. Such optimisation is becoming critical as central funding budgets shrink and universities are asked to “deliver demonstrable benefits to the economy, society, public policy, culture or quality of life” as part of demonstrating research excellence, such as HEFCE’s new Research Excellence Framework taking effect in 2014. Demonstrable benefits start with a set of benchmarks proving current performance.
Universities are tasked with many goals. In technology transfer, the strategic goal is usually articulated as providing benefit to the public, largely but not solely through supporting economic growth and the creation of jobs. This goal translates to aiming to optimise the flow from laboratory to commercial application, rather than maximising income. A university which manages technology transfer well can create a virtuous circle, where success in technology transfer enhances its research standing, attracting funding, contacts, and personnel to enhance its research, which again improves its technology transfer.
Given that universities have limited resources, it is important for them to maximise outputs per unit of input in every area. A key tool for this is benchmarking; by comparing its own input and output metrics with those of comparable institutions, a university should be able to focus on improving or shrinking activities where it underperforms or growing activities where it overperforms.
In contrast to other expenditure areas, in technology transfer, the standard metrics do not seem to provide full information for analysing performance. For example, the normal scalar used to equate outputs between different universities is total research spending, but there are large differences between expected output for £1m spent on research in life sciences, in physical sciences, or in the humanities. A comparison of say Imperial College and the School of Oriental & African Studies is unlikely to be meaningful if each output metric is simply divided by the total research spending of the university.
Again, the total number of patents granted is a standard metric, but the number of patents with material license income is not. Therefore it is not possible to measure the relative quality of patents between different universities. Patents are expensive, and a university generating a relatively high number of patents with a relatively low number obtaining license fees is likely to be able to improve its efficiency (ratio of outputs to inputs) by changing some of the thresholds in its decision processes.
Z/Yen has begun compiling an extended set of metrics which would be of use for particular purposes, and would discuss these with the participants to agree these to be included. It is intended that results would be anonymised and scaled so that it would not be possible to identify the metrics for individual universities. An outline programme might be:
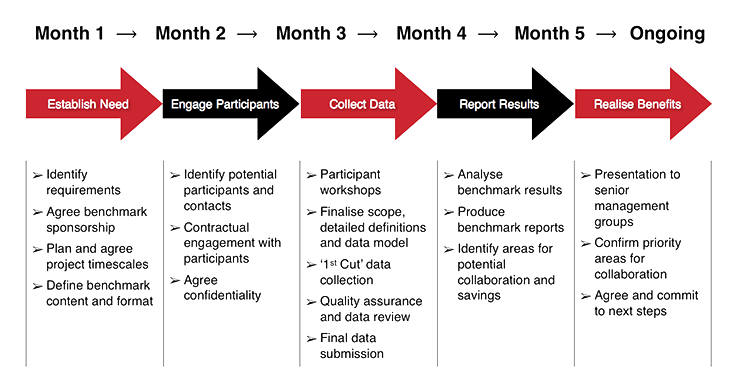
Initially, participants would engage with the benchmarking exercise through a structured interview so that we can agree and validate the proposed metrics and iron out problems by developing consistent definitions. We anticipate that this would take three or four hours, but would have the upside of giving you independent feedback on issues of interest. The second stage would be comment on a detailed proposal which we would pull together after meeting with participants.
Next Steps
This note is designed to initiate conversation. Z/Yen is interested in exploring these issues further with all parties. Please contact Michael Mainelli, Director, Z/Yen Group Limited, Michael_Mainelli@zyen.com