IFCs Improve Their Position In The Global Financial Centres Index
By
Mike Wardle, Professor Michael Mainelli
Published by As published by IFC Review, Tuesday 23 January 2024
In 2005, the Z/Yen Group undertook research for the City of London on the competitiveness of financial centres. Previous research in this area had compared a small number of centres, typically just London, Frankfurt, Paris, and New York. We developed the Global Financial Centres Index (GFCI) from that research to recognise that financial centres were developing across the world with the intention of offering a dynamic measure of the comparative strength of financial centres. The first edition of the GFCI was published in 2007. In September 2023, Z/Yen published the 34th edition of the index, which is updated twice a year.
The GFCI is a factor assessment index that combines two distinct sets of data to create a rating for financial centres:
- Instrumental Factors: Quantitative measures focused on cities and countries provided by a wide range of organisations including the United Nations, OECD, and World Bank. A total of 147 instrumental factors were used in GFCI 34.
- Financial Centre Assessments: Ratings of the competitiveness of financial centres, and of their strength in FinTech, provided by finance professionals across the world by means of an online questionnaire which has run continuously since 2007. For GFCI 34, Z/Yen used more than 53,000 assessments of centres provided by over 9,000 individual respondents to the survey.
A feature of the development of financial centres has been the growth in the number of financial centres working across borders. In 2007, GFCI 1 provided ratings for 46 financial centres, including just two IFCs – Cayman Islands and Bermuda. GFCI 34, published in September 2023, provides ratings for 121 financial centres worldwide, including all the major IFCs. This increase reflects the continuing development of the world economy, and in particular trade expansion, which has provided a platform for the development of financial services in new markets and new business sectors, and the demand for investment, insurance, shipping finance, and cross-border transactions.
GFCI 34 Results
In GFCI 34, the average rating of centres in the index rose 3.63 per cent compared with GFCI 33, with all but two centres improving in the ratings. This suggests growing confidence in financial centres and the world economy, notwithstanding the challenges caused by continued supply chain difficulties and the instability caused by the continuing war in Ukraine. US centres performed well, with five US centres in the top ten, reflecting the strength of the US economy. Leading Chinese centres were stable in the rankings.
There was little movement at the top of the index ranking, with the top seven centres retaining their rank position. New York leads the index, with London second, ahead of Singapore and Hong Kong in third and fourth positions. Washington DC and Geneva entered the top ten in this edition of the GFCI, replacing Seoul and Boston.
In the separate FinTech rankings, New York retains its leading position, followed by London, which overtook San Francisco to take second position. Shenzhen maintained its fourth place in the table. Beijing has joined Singapore, Los Angeles, Washington DC, Shanghai, and Chicago in the top ten, replacing Boston. There was a fair amount of dynamism in the FinTech ranking, with 22 centres rising ten or more places in the ranking and 29 centres falling ten or more places.
IFC Performance In The GFCI
Chart 1 shows the GFCI ratings for IFCs over the five years from early 2019 to late 2023. The trend is on average downward, but all centres in the group rose in the ratings in GFCI 34, with a clear upward trend for IFCs since GFCI 31 (March 2022). Jersey continues to lead the group, although other centres are performing well, with Guernsey, the Isle of Man and Cayman Islands competing for the top place among the group.
Chart 1 | IFC GFCI Ratings Over Five Years
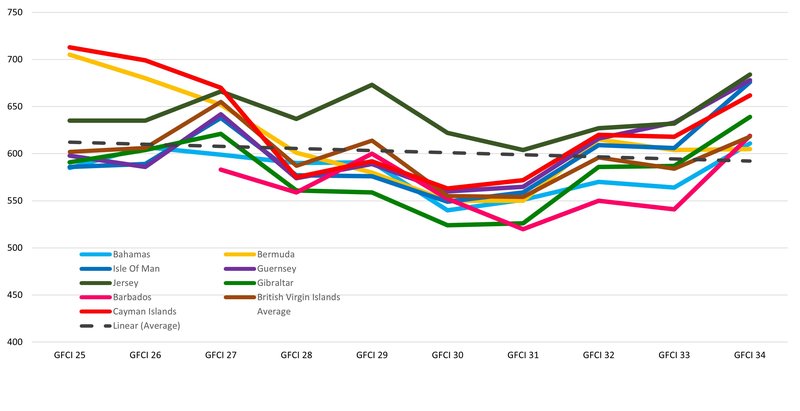
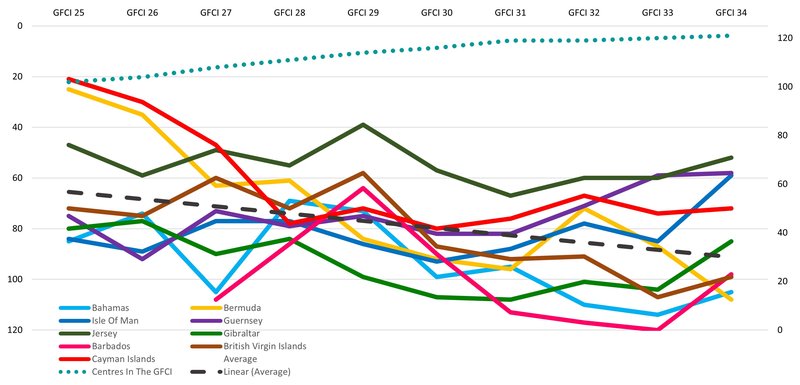
Chart 2 tracks the ranking of IFCs over time. The average rank of IFCs in the GFCI has fallen steadily as more financial centres have entered the index. Most centres have seen a recovery in their rank position in GFCI 34, with the Isle of Man, Gibraltar and Barbados showing large improvements in their rank position in this edition. Bermuda has fallen back after improvements in GFCI 32.
Chart 2 | IFC GFCI Rankings Over Five Years
These recent improvements in IFC ratings and rankings appear to show increased confidence in IFCs as economies adjust in the current shocks caused by the aftermath of Covid-19, war, supply chain uncertainties, and rising inflation.
Specialisation & Regional Reputation
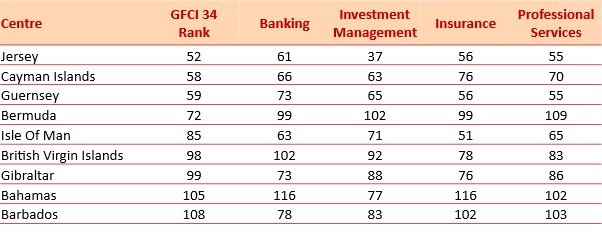
There are sectors of finance in which IFCs reputation remains strong. Table 1 shows the results of selected industry sector sub-indices that we run using survey assessments from just those working in different sectors of finance. This shows centre strengths, with the Isle of Man ranking higher than its overall GFCI ranking in each of these sub-indices. Gibraltar and Barbados rank higher than their overall GFCI rank in the banking sub-index. Jersey, British Virgin Islands, Gibraltar, Bahamas, and Barbados rank well in the investment management sub-index. Guernsey, British Virgin Islands, Gibraltar, and Barbados improve on the GFCI rank within the insurance sub-index. Within the professional services sub-index, Guernsey, British Virgin Islands, Gibraltar, Bahamas, and Barbados also rank higher than their overall GFCI rating.
These results give an indication of which industry sectors rate IFCs more highly than the overall population of financial professionals.
Table 1 | IFC Performance in Selected Industry Sub-Indices
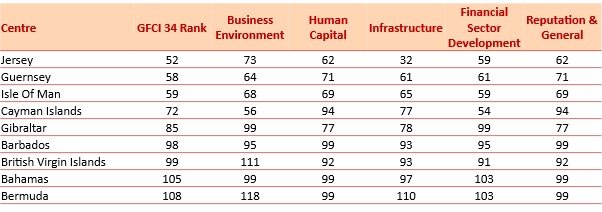
We also produce sub-indices based on groups of instrumental factors – the areas of competitiveness in the GFCI. As Table 2 shows, IFCs are generally weaker in the sub-indices relating to business environment measures, where they may struggle to compete with larger centres based in cities. There are mixed results in the other sub-indices. However, there are successes, with Jersey gaining 20 places in the infrastructure sub-index compared with its overall position in GFCI 34, and Cayman Islands gaining 16 places in the business environment sub-index and 18 places in the financial sector development ranking. The reputation and general area of competitiveness is challenging for Jersey, Guernsey, Isle of Man, and Cayman Islands.
Table 2 | IFC Performance In The Areas Of Competitiveness Sub-Indices
When looking at relative assessments, for all Caribbean centres other than British Virgin Islands, the assessments given by respondents from North America in the GFCI survey are higher than the global average, whereas these same respondents tend to rate European IFCs below the global average. The opposite pattern is true for respondents from Western Europe, who rate European IFCs higher than the global average, and Caribbean centres generally lower.
Between 18 per cent (Jersey) and 50 per cent (Bahamas) of assessments provided to IFCs are from people in the Asia/Pacific region. However, for all IFCs, assessments form people in Asia/Pacific are lower than the global average.
This analysis suggests that there is room for IFCs to target their development work to strengthen business links with parts of the world that currently rate them less highly than others, in particular in Asia/Pacific.
Talent Development
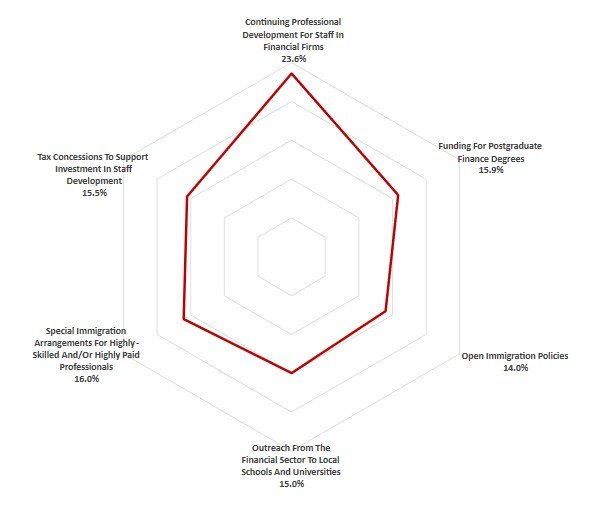
Financial centres worldwide continue to focus on key priorities, including sustainable finance, the development of skills, and the impact of digital technology. These areas are driving changes to regulatory and development systems. We undertook specific research in 2023 on the strategies needed to develop the talent pool. Chart 3 shows the response to our survey on this issue with the highest number of respondents to the survey saying that continuing professional development is important in ensuring the future strength of talent in finance, with special immigration arrangements the second most frequently mentioned area.
Chart 3 | Most Important Strategies For Maintaining and Developing The Talent Pool
Other strategies suggested by respondents to assist with the development and maintenance of the talent pool were:
- Appropriate salary and benefits packages, relative to local costs.
- Incentives for job creation whether through subsidies or support for training.
- Introducing finance in the school curriculum and building links between financial firms and schools, colleges, and universities.
- Ensuring a good quality of life for international talent, alongside flexible immigration policies.
Through the Global Financial Centres Index, the Global Green Finance Index, and the Smart Centres Index, Z/Yen will continue to track the development of the world’s financial and commercial centres as they continue to make progress in serving the needs of international business.