Finance Looking Fine, Looking DAPR: The Importance Of Dynamic Anomaly & Pattern Response
By
Professor Michael Mainelli
Published by Balance Sheet, The Michael Mainelli Column, Volume 12, Number 5, Emerald Group Publishing Limited (October 2004), pages 56-59.
Appearances Can Be Enlightening
As financial markets get ever more competitive, finer and finer distinctions in timing and price make all the difference. Financial service firms are increasingly looking at DAPR systems for their new finery:
- dynamic - adaptive and learning from new data in real-time;
- anomaly - identify unusual behaviours;
- pattern - reinforce successful behaviours;
- response - initiate a real-time action.
DAPR systems have been mooted for many years, e.g., even before IT departments were toying with neural nets. However, recent advances in statistics, such as statistical learning theory, are being successfully applied in a number of markets from manufacturing through logistics to finance where IT systems need to be applied in dynamic environments and the rules cannot be precisely specified in advance because they change. The key change from previous approaches is that applications are being deployed instantly from statistical models rather than using statistics to inform rule-based programmers who then make changes over time. Current applications include systems in areas such as:
- wholesale finance – KRI (Key Risk Indicators) loss prediction, benchmark models for complex products, liquidity analysis for best execution, investment opportunity scouting, cross-product sales targets or reducing non-STP trades;
- retail finance - credit scoring, product targeting, predictive consumer and business profitability;
- fraud detection - anti-money laundering, credit card fraud;
- management information – comparing performance of diverse products, regions or clients, setting benchmarks, finding anomalies that matter, real-time MIS.
- information technology and communications - network routing, revenue enhancement, revenue protection;
Case Study 1 – Reducing Non-STP Trades:
An example of a DAPR system in action comes from an investment bank trialling Z/Yen’s PropheZy. This investment bank makes approximately 25,000 trades a week in one wholesale product. Just under 5% of the trades generate exceptions, i.e. instead of going STP (straight through processing). These exceptions need to be manually examined and corrected. The cost of an exception is many times that of an STP trade. The IT department has tried on numerous occasions to implement rule-based, front-end systems that force traders to make correct entries, but within weeks an unusual trade becomes commonplace or a commonplace trade today becomes unusual. The IT impedes the traders and loses the firm money. If exceptions could be caught within 15 to 30 minutes, the bank can take action in its middle-office to reduce costs. PropheZy’s job is to tell the middle-office of trades that it thinks likely to be non-STP. Current success rates are above 90%, reducing the exceptions from the 5% level to less than 1%, i.e. from over 1,200 problem trades per week to under 250. DAPR systems will adjust to the fact that today’s unusual trade, e.g. a very large trade with an under-capitalised regional bank, may become tomorrow’s norm, e.g. the regional bank has been recapitalised. PropheZy rebuilds a new application every week that then includes the past week’s performance. Traditional programming or parameterised approaches cannot keep up with the rate of change. A similar approach is being tried in insurance markets where DAPR systems are being used to identify policies that “don’t feel right” as they are entered.
Emperor’s Old Clothes
DAPR systems are exciting because they have the potential to realize some of the oldest ambitions in computing. Dating back to at least to Rosenblatt’s 1957 paper on “perceptrons”, many people in IT have had the ambition to build systems that used historic data to help humans make decisions in real time. Over the years, numerous techniques have been deployed with varying degrees of success, e.g. neural networks, K-Nearest Neighbor classification and other clustering techniques, decision-tree or rule-based classifiers, expert systems, Bayesian inference engines, naïve Bayesian classifiers and many forms of regression. Each of these approaches failed to be used widely for different reasons.
For instance, neural networks provide different responses when data is entered in a different sequence. Most of the other techniques needed human tuning, leading to questions about how the humans were choosing parameters. So, until recently, if Hans Christian Andersen’s honest boy looked at the state of most financial IT he might well say, “but these are just transaction processing (TP) systems that do a bit of summation and reporting; why can’t these systems help us make real time decisions?”
However, things have been changing rapidly since the mid-1990’s. Vladimir Vapnik’s work in the field of Statistical Learning Theory has become a solid foundation for machine learning. Statistical Learning Theory introduces several crucial concepts including structural risk minimisation, support vector machines and support vector regression that have been proven to work in demanding environments, e.g. robotics, handwriting recognition, speech recognition. Now Statistical Learning Theory is one of the leading approaches providing new DAPR systems in finance.
Part of the excitement surrounding Rosenblatt’s ambition is the potential to develop and deploy systems immediately from the analysis of historic data. Rather than focusing on analysis, the focus is on obtaining value from historic data, learning. In Case Study 1 above, each new non-STP trade generated is fed back into the DAPR systems and helps the system improve its future performance. As certain trades that would formerly have failed are fixed, e.g. by fixing some standing data problems, the DAPR system learns that these trades are now of less STP risk. Systems in the field are moving from basic TP systems with a few rules, to flexible systems that re-configure their behaviours based on their historic successes and failures.
Case Study 2 – Best Execution Process:
Asset managers increasingly require assurance that brokers are obtaining ‘best execution’, i.e. execute customer orders at the best price available at the time the trade is entered. For highly-liquid instruments, demonstrating best execution is simply showing that the trades are executed at current prices, quickly, before there is much chance of price movement. For less-liquid instruments, the price obtained will almost certainly not be the best price at the time available. The price difference can be due to significant market fluctuations or poor liquidity or information leakage. Asset managers who wish to exceed the ‘normal market size’ for an instrument would like to have some assurance that the price obtained for an abnormal market size is within normal tolerances. DAPR systems are being trialled where historic trading data is being used to tell which trades seem anomalous. The DAPR systems take into account general market conditions as well as the particular trading characteristics, liquidity and normal market size of specific instruments. While the DAPR systems can be used in real-time, tantamount to predicting market prices, they can be used as close-of-day control systems where a small proportion of trade prices are queried because they exceed certain tolerances. These DAPR systems are ‘data driven’, that is to say, historic data is being used to develop a new application each day that tells users what is anomalous or interesting about the next day’s activities.
While many DAPR systems are stand-alone analytical packages or come as a set of programming tools or are embedded deep in existing applications such as certain anti-money-laundering products, some of the new DAPR systems have interesting IT architectures. Some highly flexible approaches use XML with ‘add-ins’ to Excel, for instance:
- an Excel add-in comprising the user interface, help files, data
- manipulation and reporting;
- a DAPR application builder that takes clean data via a XML document and builds a predictive mathematical model for use by a DAPR engine;
- a server-side DAPR engine manager capable of handling hundreds of simultaneous users requesting predictions on different models via XML documents;
- a visualisation suite that helps users understand how decisions are being made by the DAPR system.
The systems development in some systems is truly as simple as pressing two Excel add-in buttons, one to build the DAPR model and the second to use the DAPR model to make predictions. With XML documents as the key interface, DAPR systems can fit easily into existing applications or even, with a simple HTML front-end, be rolled out globally in minutes across the internet. In this way, statistical applications are moving from looking backwards to looking forwards and noting strange, odd or unusual events in real-time. DAPR may have substantial ramifications in the way numerous systems problems are approached technically, as well as perhaps the architecture of systems (imagine thousands of autonomous DAPR engines handling workflow and responding to changes in the environment immediately).
Tell Me If I Look Good In This
Where do DAPR systems fit? The following diagram sets out a simple model of finance as one where risks are selected through positioning and marketing and then priced by attempting to ascertain the difference in value to customers and the cost of capital:
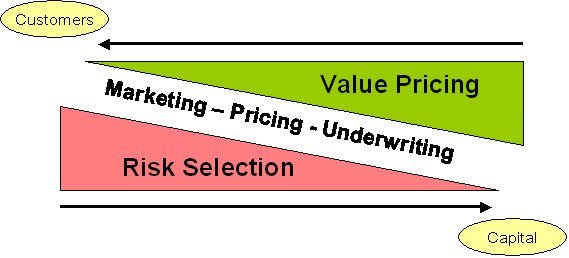
DAPR systems fit into the model in each of the three main activities, marketing, pricing and underwriting. By releasing the tremendous value in hard-won, historic data, DAPR systems can help firms improve decision-making in every area of risk selection and value pricing whether it is recommending products to customers, pricing packages of products, calculating likely competitive prices, spotting unusual trends in wins or losses, or just helping to audit the entire process by indentifying anomalies. DAPR systems should be considered anywhere there is a need to investigate anomalies OR reinforce patterns. DAPR systems are of most use where:
- there is a testable proposition – some historic data is needed that is consistent and valid, although not necessarily large volumes. For instance, some of the newer software can be successfully used with just tens of data instances. DAPR systems are bringing approaches traditionally thought to be of use with very large datasets, e.g. scorecards or Z scores, into use with much smaller datasets;
- there is a clear classification of outcomes – DAPR systems are for decision-making. The clearer the potential decisions, the more effective the DAPR. For instance, while DAPR systems can indicate potential prices in the best execution Case Study 2 above, a clearer use would be to indicate simply whether or not a trader needs to be asked about a particular trade. It is worth noting that there must be an ability to use some of the DAPR predictions, e.g. to rectify a probable non-STP trade;
- data changes moving forward – if the data is static, then DAPR systems are of less use as traditional statistics will probably do just as well;
- there is a feedback loop on predictions – DAPR systems improve if they are given data on their performance. In practice, a small random sampling of normal event outcomes also helps, for instance, having a small selection of probable non-money-laundering transactions investigated to ensure that the DAPR system is not totally constrained by historic data.
It is not all plain sailing with DAPR systems. As a data-driven approach, DAPR systems are only as good as the data put into them – “garbage in, garbage out”. In some areas, the data may not be at all predictive. More rigour needs to be used as the data becomes more important. Data quality can vary over time in hard-to-spot ways. For instance, one trial of KRI [ loss prediction found that the IT department was miffed at IT downtime being considered a “key risk indicator” and unilaterally changed the KRI to “unplanned” IT downtime, skewing the predicted losses. This change was spotted when using the DAPR system to run the reverse loss [ KRI prediction as a quality control. DAPR approaches are moving the competition in IT from “not dropping the ball”, i.e. having reliable TP systems, to the ability to provide high-quality value pricing and risk selection.
Some Areas to Consider DAPR
| Banking | Insurance | |
|---|---|---|
| Input, Process, Output |
¨ correcting potential non-STP, failed trades ¨ workflow routing ¨ anti-money-laundering compliance ¨ credit scoring |
¨ identifying incorrect policies ¨ workflow routing ¨ anti-money-laundering compliance ¨ pricing policies |
| Feedforward |
¨ benchmarks for quantitative trading performance or model validation ¨ benchmarks for profit/trade, sales credits, cost/trade ¨ direct marketing |
¨ cross sales ¨ investigation budgeting ¨ straight-through-payouts on claims and fees, e.g. legal ¨ direct marketing |
| Feedback |
¨ customer profitability ¨ best execution process control |
¨ customer profitability ¨ claims for investigation |
| Monitoring & Governance |
¨ KRI D loss prediction ¨ setting MIS alert tolerances |
¨ KRI D loss prediction ¨ setting MIS alert tolerances |
IT systems formulated from a statistical viewpoint give systems that make ‘good enough’ decisions, for example a system that automatically approves claims without human intervention based on the probability of fraud. DAPR approaches require quite a re-think for traditional business and IT managers. Autonomous decisions based on historic data raise new management issues in data acquisition, data cleansing, auditing, model testing and integration with existing systems. In many ways, this is a frightening future. The machines make the decisions. However, in many ways it is a more secure future, using the data organisations expensively acquire to improve performance. The leaders in finance are not going DAPR for ostentatious frippery but for finer profits.
[An edited version of this article originally appeared in “Finance Looking Fine, Looking DAPR: The Importance of Dynamic Anomaly and Pattern Response”, Balance Sheet, The Michael Mainelli Column, Volume 12, Number 5, Emerald Group Publishing Limited (October 2004) pages 56-59.]
Michael Mainelli, PhD FCCA MBCS MIS, originally did aerospace and computing research followed with seven years as a partner in a large international accountancy practice before a spell as Corporate Development Director of Europe’s largest R&D organisation, the UK’s Defence Evaluation and Research Agency, and becoming a director of Z/Yen (Michael_Mainelli@zyen.com).
Michael’s humorous risk/reward management novel, “Clean Business Cuisine: Now and Z/Yen”, written with Ian Harris, was published in 2000; it was a Sunday Times Book of the Week; Accountancy Age described it as “surprisingly funny considering it is written by a couple of accountants”.
Z/Yen Limited is a risk/reward management firm helping organisations make better choices. Z/Yen undertakes strategy, finance, systems, marketing and intelligence projects in a wide variety of fields (www.zyen.com), such as developing DTI Smart award-winning DAPR software, developing new risk transfer services or benchmarking transaction costs across global investment banks.