Chapter 10: Correlation Causes Questions: Environmental Consistency Confidence In Wholesale Financial Institutions
By
Professor Michael Mainelli
Published by Frontiers of Risk Management: Key Issues and Solutions, Dennis Cox (ed), Euromoney Books (2007), pages 94-100.
Professor Michael Mainelli, Executive Chairman, The Z/Yen Group
[An edited version of this article first appeared as "Chapter 10: Correlation Causes Questions: Environmental Consistency Confidence In Wholesale Financial Institutions", Dennis Cox (ed), Frontiers of Risk Management: Key Issues and Solutions, Euromoney Books (2007) pages 94-100.]
Introduction
Wholesale financial institutions have tried a number of approaches for managing and modelling operational risk, with limited success. Z/Yen Limited have developed an approach called Environmental Consistency Confidence meaning, basically, if you can predict incidents and losses with some degree of confidence, then your modelling is useful. It is often said that “correlation doesn’t demonstrate causation”. That is true, but “correlation should cause questions”. The core of Environmental Consistency Confidence is using modern statistical models to manage financial institutions through the examination of correlations between activity and outcomes. This paper sets out how Environmental Consistency Confidence works, how it differs slightly from other approaches, its basis in system dynamics, its fundamental concept of Predictive Key Risk Indicators for Losses and Incidents (PKRI-LI), and two early trials showing promising results.
Wholesale financial institutions have tried applying system dynamics and modelling techniques from at least the 1970’s with minimal returns. Investment banks have modelled trading floors in order to see how to optimise trade flows, large payments processors have tried modelling their multi-path networks in order to optimise processing time and security. Further, Basel II initiatives led numerous wholesale institutions to document their operations in order to show their control of operational risk. Nevertheless, a few decades on, it is clear that the application of formal system dynamics modelling tools is rare, at least in the minds of systems modelling experts, when compared with some other industries.
Wholesale financial institutions may have smaller transaction volumes than retail institutions, but even a modest investment bank can process 250,000 equity trades a week. The very largest investment banks might handle 40 million equity trades a year and large amounts of foreign exchange, money markets and other instruments. With large numbers of transactions, numerous paths and variable activity levels this should be a fruitful environment for the application of system dynamics, yet most wholesale operations managers do not believe that system dynamic techniques bear fruit. A number of factors contribute to this lack of apparent benefit. Firstly, wholesale trading finance is a fast-changing environment with little time for analytical reflection and a need for quick pay-back on investment in operations. Secondly, there has been only a modest amount of emphasis on the ‘back-office’ processing operations; most of the emphasis has been on supporting the ‘front-office’ trading floor. Thirdly, wholesale institutions tend to respond positively to regulatory initiatives setting out operations standards, but otherwise do what everyone else is doing. Thus, despite a few trials of system dynamics approaches, since almost no one has a big success story in an environment where rapid, perhaps overly rapid, decisions are taken, almost no one will undertake a systems modelling project.
Operational Risk
According to §644 of the “International Convergence of Capital Measurement and Capital Standards” (June 2004) from the Bank for International Settlements, known as Basel II (see http://www.bis.org/publ/bcbs107.htm), operational risk is defined as the “risk of loss resulting from inadequate or failed internal processes, people and systems, or from external events.” Since operational risk became a regulatory discussion topic in the early 1990’s, a number of approaches have been tried to both measure it and manage it, and been found wanting. Arguably, the evolution of current thinking about operational risk has already had three stages:
- OpVAR – “operational value-at-risk”. This was an early approach that attempted to treat operational risk in the same manner as market and credit risk. The basic idea was to build a large, stochastic model of the various operational risks and use Monte Carlo simulations to calculate a “value-at-risk” that would allow a financial institution to set aside an appropriate amount of capital. This approach requires probability distributions of operational risk, in the same way banks analyse market movements or credit defaults. A few industry initiatives attempted to collect large datasets of operational risk losses, e.g. defalcation by employees, but found that the data was heterogenous and difficult to extract because of its sensitivity – who wants to admit publicly they’ve been defrauded. OpVAR still has a place as a useful analytical check, but not as a primary means of measuring and managing operational risk;
- Process modelling – many financial institutions documented their operations in order to analyse their operational risks. Many of the tools used to document the operations were also the same tools used to input models to system dynamics simulation software. While this also led many institutions to experiment with system dynamics techniques, they then encountered problems of validating the models and chaos theory effects, i.e. extreme sensitivity to initial conditions. Further, this approach failed to provide a useful measure for banks to calculate an appropriate amount of capital to set aside to cover operational risk;
- Risk dashboards or ‘radar’ – some financial institutions explored the application of compliance tools that required operational managers to prove that they had followed procedures that minimised operational risk. While this heuristic approach is culturally suited to banks (it’s bureaucratic ‘tick-bashing’ and form-filling with which they are familiar), it also fails to provide an overall measure of operational risk. Further, there was little consideration of the human systems within which this approach was being applied so, for instance, people just repeatedly answered questions with the desired answer, e.g. “is your computer room secure” – “yes”, thus negating any benefit. Finally, this approach results in a lot of RAG (red-amber-green) type reports that cannot be readily summarised numerically and are incapable of contrasting different risks other than by their frequency or place in the taxonomy. So, with little account taken of the severity, five open computer room door incidents may be rated more important than a single total power outage.
Elements of these three approaches are still used, and useful, but on their own they do not provide measurement and management of operational risk. There are some other approaches worth noting. Though these have not been as popular, they may have more long-lasting benefits:
- Culture change – as operational risk is primarily risk generated by people internally (people fail to follow processes or deliberately sabotage or make poor decisions), a culture that promotes reduced operational risk should provide significant benefits [Howitt, Mainelli and Taylor, 2004]. This approach, however, does not provide a measure of operational risk for capital purposes;
- Cost-per-transaction variance – this approach attempts to contrast operational risk across products by fully allocating costs to each transaction, thus generating a more typical distribution curve for risk [Mainelli, May 2004]. This approach does find system dynamic modelling useful, to help allocate pooled costs based on activity levels (activity-based costing), and does appear to work in practice and across the industry. However, this approach has not been widely adopted, possibly because the full-blown version requires extensive, and expensive, systems modelling, and possibly because the regulators have been slow to see that it does help them provide comparable metrics, though those metrics are not traditional.
Another approach worth evaluating, that leads to a slightly different view of how system dynamics is applied to the organisation, is the use of Key Risk Indicators.
What Is A Key Risk Indicator (KRI)?
“Key Risk Indicators: risk indicators are statistics and/or metrics, often financial, which can provide insight into a bank’s risk position. These indicators should be reviewed on a periodic basis (often monthly or quarterly) to alert banks to changes that may be indicative of risk concerns. Such indicators may include for example the number of failed trades, staff turnover rates and the frequency and/or severity of errors and omissions.”
Basel Committee on Banking Supervision, “Sound Practices for the Management and Supervision of Operational Risk”, December 2001.
“KRIs are measurable metrics or indicators that track different aspects of operational risk.”
The Risk Management Association, The KRI Banking Study, 2005, page 5.
A working definition is “regular measurement based on data which indicates the operational risk profile of a particular activity or activities”. KRIs can be environmental, operational or financial. For instance, environmental indicators (that might turn out to be KRIs) could be such things as trading volumes and volatilities on major commodities or foreign exchange markets. Operational indictors (that might be KRIs) could be general activity levels in the business, numbers of deals, mix of deals, number of amendments, staff turnover, overtime or IT downtime. Financial indicators (that might be KRIs) could be things such as deal volatility, dealing profit, activity-based costing variances or value of amendments.
The key link is to apply a more scientific approach to managing risk. Firms must test the usefulness of operational risk data collection by using losses or incidents to discover what the indicators should have been. In other words, what drives operational risk ? We describe this approach as predictive key risk indicators to/from loss/incidents prediction (PKRI-LI).
The important point to note is that people can suggest many possible risk indictors (RIs), but they are not Key Risk Indicators (KRIs) unless they are shown to have predictive capability for estimating losses and incidents. A KRI must contribute to the predictability of losses and incidents in order to be validated as a KRI. If an RI does not predict losses or incidents, it remains an interesting hypothesis, someone’s unvalidated opinion. Experience does help to identify the true drivers of operational risk and should help focus attention and control actions, but the PKRI-LI approach supports and validates (or invalidates) expert judgement of true drivers of operational risk losses. The intention of this approach is not to replace expert judgement, but to support that judgement in a more systematic way in an ever-changing environment.
Why Are KRIs Important?
KRIs are important for at least four reasons:
- KRIs measure probable operational risk arising over a time period, as opposed to tracking operational risk, and thus make an appropriate management tool for operational risk;
- KRIs help to form an input for economic capital calculations by helping to produce estimates of future operational risk losses and thus helping to set a base level of capital for operational risk;
- KRIs are increasingly examined by rating agencies, e.g. Moody’s or Standard & Poors, and financial analysts;
- KRIs are increasingly important to regulators.
Without capturing incidents and loss data, there is nothing to predict. Sound incident data capture is a prerequisite for anything but the most basic capital allocation under Basel II. It is worth quoting at length from Basel II (see http://www.bis.org/publ/bcbs107.htm for full text) as this shows what regulators expect both for operational risk and for key risk indicators
676. In addition to using loss data, whether actual or scenario-based, a bank’s firm-wide risk assessment methodology must capture key business environment and internal control factors that can change its operational risk profile. These factors will make a bank’s risk assessments more forward-looking, more directly reflect the quality of the bank’s control and operating environments, help align capital assessments with risk management objectives, and recognise both improvements and deterioration in operational risk profiles in a more immediate fashion. To qualify for regulatory capital purposes, the use of these factors in a bank’s risk measurement framework must meet the following standards:
- The choice of each factor needs to be justified as a meaningful driver of risk, based on experience and involving the expert judgment of the affected business areas. Whenever possible, the factors should be translatable into quantitative measures that lend themselves to verification.
- The sensitivity of a bank’s risk estimates to changes in the factors and the relative weighting of the various factors need to be well reasoned. In addition to capturing changes in risk due to improvements in risk controls, the framework must also capture potential increases in risk due to greater complexity of activities or increased business volume.
- The framework and each instance of its application, including the supporting rationale for any adjustments to empirical estimates, must be documented and subject to independent review within the bank and by supervisors.
- Over time, the process and the outcomes need to be validated through comparison to actual internal loss experience, relevant external data, and appropriate adjustments made.
There are a number of KRI initiatives in the financial services industry to share best practice on KRIs and loss/incident reporting or collection. A leading initiative is the Risk Management Association’s “KRI Banking Study”, KRIeX (see www.kriex.org), in which some 50 banks defined 1,809 KRIs, though the relevance of these has not been tested using PKRI-LI prediction (to be fair, there has been some talk of doing something at an unspecified point in the future). Some examples of the Risk Management Association’s KRIs are the percentage of transactions requiring manual input, percentage of unsettled transactions after due dates and theft/1,000 ATMs. A breakdown of the KRIs by category and number is set out in the diagram below:
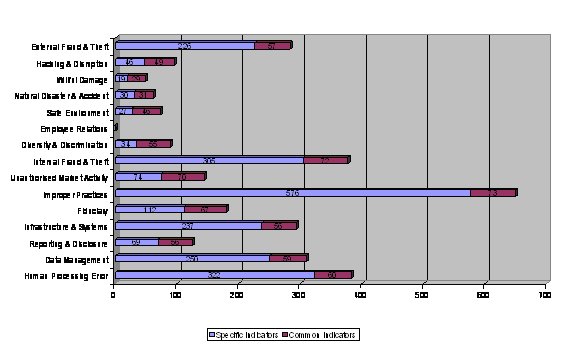
It is implausible to ask any organisation to track 1,809 key risk indicators. To be fair, only 74 indicators are common and apply to virtually all risk points. Further, only (sic) 533 are “high-risk points”. While some participants may be involved in order to “done to be seen” by regulators, KRIeX is a valuable resource. This is an exhaustive approach at an early stage that does help by providing a starting set of RIs, but the KRIs for different institutions must evolve from individual institutional experience, rather than being imposed over-heavily from a template. The table below sets out the characteristics of a KRI as seen by the Risk Management Association:
| Effectiveness | Comparability | Ease of Use |
|---|---|---|
| Indicators should... | Indicators should... | Indicators should... |
|
1. Apply to at least one risk point, one specific risk category, and one business function. 2. Be measurable at specific points in time. 3. Reflect objective measurement rather than subjective judgment 4. Track at least one aspect of the loss profile or event history, such as frequency, average severity, cumulative loss, or near-miss rates. 5. Provide useful management information. |
1. Be quantified as an amount, a percentage, or a ratio. 2. Be reasonably precise and define quantity. 3. Have values that are comparable over time. 4. Be comparable internally across businesses. 5. Be reported with primary values and be meaningful without interpretation to some more subjective measure. 6. Be auditable. 7. Be identified as comparable across organisations (if in fact they are.) |
1. Be available reliably on a timely basis. 2. Be cost effective to collect. 3. Be readily understood and communicated. |
In a sense the choice is between what is currently done informally (no significant business lacks RIs) and what could be done better through more formality, statistics and science to make them KRIs. For each KRI, there needs to be definition and specification. The Risk Management Association’s template specification structure gives a flavour of what this means:
| Definition | Specification | Guidance |
|---|---|---|
| KRI Number | Specification Version | Usage |
| KRI Name | Term Definitions | Collection Frequency |
| Description | Value Kind | Reporting Frequency |
| Rationale/Comments | Dimensions | Frequency of Change |
| Nature | Limitations on Scope | Collection Level |
| Type | Buckets | Variants |
| Typography | Bucket Variants | Directional Information |
| Ratings | Definition Thresholds | Extraneous Information |
| Measurement Rules | Control Indicator | |
| Underlying KRIs | Source | |
| Calculation Method | ||
| Benchmark Rules | ||
| Aggregation Method | ||
| Scaling Denominator | ||
| Scaling Rules |
PKRI-LI Issues
One could readily conclude that a fairly static KRI can’t be “key”. For example, a KRI such as the number of lawsuits received by a particular function might change very little for long periods. In this case one might wish to examine “lawsuits in period” or “estimated settlement values” or other more sensitive measures than just a very slow-changing “outstanding lawsuits”. However, what matters is whether or not the KRI contributes to the capability of predicting operational losses/incidents, not its variability.
There is overlap between KRIs and Key Performance Indicators (KPIs). It would be easy to say that KRIs are forward-looking and KPIs are backward-looking, but far too simplistic. There are clearly overlaps. For instance, high trading volumes and high volatility on one day might be good performance indicators predicting a high-likelihood of good future financial performance turnout for that day, but also indicative of emerging operational risks from that day.
KRIs that increase in some ranges and decrease in others can cause confusion as KRIs are not necessarily linear. For example, staff overtime might be an example of a KRI with a bell-shaped curve. No overtime may indicate some level of risk as people aren’t paying attention or do tasks too infrequently; modest levels of overtime may indicate less risk as staff are now doing a lot of familiar tasks; and high rates of overtime may indicate increased risk again through stress. KRIs help to set ranges of acceptable activity levels. There can be step changes in operational risk associated with a KRI. For instance, a handful of outstanding orders at the close of day may be normal, but risk might increase markedly when there are over a dozen outstanding orders. KRIs should vary as risk changes, but they don’t have to vary linearly.
What about all the stuff that’s taken for granted? For example, electricity and water supplies may seem to be an important consideration when looking at KRIs for developing world locations, yet don’t really feature in criteria in the developed world. In the major financial centres, many things are assumed, for instance, an absence of natural threats such as hurricanes or flooding. Yet London used to have significant flood risk, and may again as the Thames Barrier comes to the end of its projected usefulness. Geologic issues such as earthquake-prone faults or health issues such as malaria don’t seem to feature. Nor does terrorism risk seem strong in peoples’ perceptions of what matters. There are also numerous personal issues that don’t feature – work permits, opening bank accounts, arranging for utilities, schools, personal safety – any of which could scupper a trading floor. Somewhat naturally, people tend to care about those things of which they are conscious. Any of a number of issues could have us looking back several years from and grimly nodding about how trading ceased to function when “people wanted to avoid concentrating terrorism risk” or “infectious diseases just became too dangerous to have people so highly concentrated”. The PKRI-LI approach is an approach for regular management, not extreme events.
It is a combination of factors that makes a set of KRIs successful, not just a single factor. Jared Diamond derives an Anna Karenina Principle from the opening line of Tolstoy’s novel: “Happy families are all alike; every unhappy family is unhappy in its own way.” (Guns, Germs, and Steel, Random House, 1997). Diamond believes the principle describes situations where a number of activities must be done correctly in order to achieve success, while failure can come from a single, poorly performed activity. This is certainly the case for KRIs – the evolving set of KRIs is important, not a single one at a point in time, nor too many all the time.
Environmental Consistency Modelling Using Support Vector Machines
Two examples of Environmental Consistency Confidence projects using PKRI-LI are explained a bit later (a European Investment Bank and a Global Commodities Firm), but it is worth looking at the support vector machine approach that underlay the modelling. Both projects used classification and prediction tools based on support vector machine mathematics to undertake predictive analysis of the data. Support Vector Machines (SVMs) are algorithms that develop classification and regression rules from data. SVMs result from classification algorithms first proposed by Vladimir Vapnik in the 1960’s, arising from his work in Statistical Learning Theory [Vapnik, 1995, 1998]. SVMs are based on some wonderfully direct mathematical ideas about data classification and provide a clear direction for machine learning implementations. While some of the ideas behind SVMs date back to the 1960’s, computer implementations of SVMs did not arise until the 1990’s with the introduction of a computer-based approach at COLT-92 [Boser, B., Guyon, I. and Vapnik, V., 1992].
SVMs are now used as core components in many applications where computers classify instances of data (e.g. to which defined set does this group of variables belong), perform regression estimation and identify anomalies (novelty detection). SVMs have been successfully applied in time series analysis, reconstructing chaotic systems and principal component analysis. SVM applications are diverse, including credit scoring (good or bad credit), disease classification, handwriting recognition, image classification, bioinformatics and database marketing, to name a few.
SVMs are said to be independent of the dimensionality of feature space as the main idea behind their classification technique is to separate the classes in many data dimensions with surfaces (hyperplanes) that maximise the margins between them, applying the structural risk minimisation principle. The data points needed to describe the classification algorithmically are primarily those closest to the hyperplane boundaries, the “support vectors”. Thus, only a small number of points are required in many complex feature spaces. SVMs can work well with small data sets, though the structure of the training and test data is an important determinant of the effectiveness of the SVM in any specific application.
SVMs compete forcefully with neural networks as well as other machine learning and data mining algorithms as tools for solving pattern recognition problems. Where SVMs do not perform well it is arguable that the algorithmic rules behind the support vector algorithm do not so much reflect incapabilities of the learning machine (as in the case of an overfitted artificial neural network) but rather regularities of the data. In short, current opinion holds that if the data in the domain is predictive, SVMs are highly likely to be capable of producing a predictive algorithm. Importantly, SVMs are robust tools (understandable implementations, simple algorithmic validation, better classification rates, overfitting avoidance, fewer false positives and faster performance) in practical applications. “The SVM does not fall into the class of ‘just another algorithm’ as it is based on firm statistical and mathematical foundations concerning generalisation and optimisation theory” [Burbridge & Buxton, 2001]. However, comparative tests with other techniques indicate that while they are highly likely to be capable of predicting, in applications SVMs may not be the best approach for any specific dataset. “In short, our results confirm the potential of SVMs to yield good results, especially for classification, but their overall superiority cannot be attested” [Meyer, Leisch, Hornik, 2002].
PropheZy and VizZy are two software packages developed by Z/Yen for classification and visualisation of data. PropheZy implements a SVM on a server (though it can be used in a local client/server mode). Naturally, as in any field of computing, there are a number of variant SVM implementations, of which PropheZy implements three types - C-SVC, nu-SVC and binary. Further, of statistical importance in replicating results is the “kernel function”. PropheZy implements four types of kernel function - linear, radial basis function, sigmoid and polynomial. The SVM types and kernel function types are described in detail in Vapnik [1995, 1998]. For this study, the SVM implementation used was C-SVC and the kernel function was linear.
Z/Yen has benchmarked PropheZy against standardised machine learning tests, e.g. appropriate StatLog test sets [Michie, Spiegelhalter and Taylor, 1994], in order to validate the SVM with good to excellent results. In industrial application, Z/Yen has trialled PropheZy extensively in financial services applications and sees great promise for SVMs and other Dynamic Anomaly and Pattern Response (DAPR) techniques in areas such as compliance [Mainelli, 2005], trade anomaly detection and scorecards [Mainelli, 2004] as well as regression and value prediction [Mainelli, Harris and Helmore-Simpson, 2003].
So far, the PropheZy server SVM has been implemented on a Linux server, a Sun Solaris server and a Windows NT server. PropheZy implements the user-interface to the server SVM via XML (extensible mark-up language). The XML user-interface can be via an HTML page, directly through a bulk file loader command line or by use of an Excel add-in that performs XML data submission from spreadsheets to the server SVM and displays results back in Excel spreadsheets. For this study, the PropheZy implementation was the Excel add-in using the Windows NT server. VizZy provides clustering, histogram, Voronoi and data cube diagrams from tabular data.
Environmental Consistency Confidence
The conjunction of SVMs with traditional system dynamics may seem unorthodox, but it gives organisations the capability of regularly applying scientific management. Our hypothesis is that certain KRIs predict future losses and incidents, so let’s test that using modern statistical tools. If our environmental factors are consistent with the outcomes, then we can be confident we are tracking the right things. From the fact we are tracking the right factors, we should then develop projects to eliminate or mitigate the causes. If we fail to predict, we are not tracking the right things and need to explore further, and fairly rapidly as it indicates that things may be ‘out of control’.
If we look at the wider system of wholesale financial institutions we see similar high-level systems that can be predicted, not just operational risk. The following diagram sets out a simple model of finance as one where risks are selected through positioning and marketing and then priced by attempting to ascertain the difference in value to customers and the cost of capital:
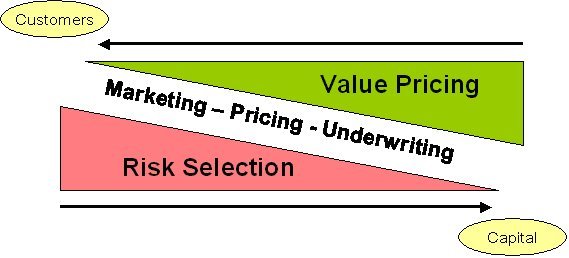
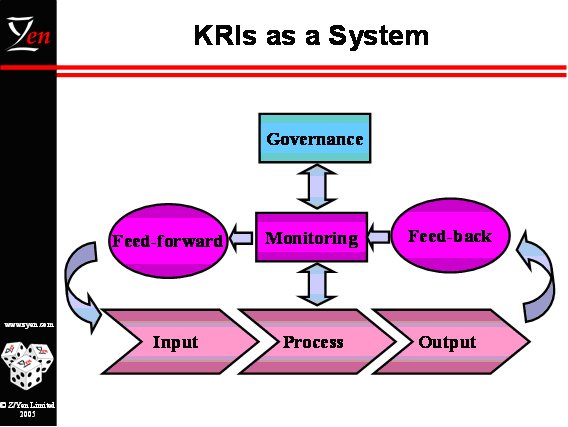
At each point in this abstract model of finance, we can use a KRI system – marketing: can we predict sales; pricing: can we predict profitability; underwriting/trading: can we predict incidents and losses? A KRI system, as with any system, has basic components:
- governance: working from the overall objectives of the business set out a definition of the operational risk framework, the calculation of economic capital and a basic set of essential KRIs;
- input: gaining stakeholder commitment, assembling resources and appointing a team that then work to establish the potential KRIs;
- process: supporting the operational risk managers through data collection, statistical validation, statistical testing, correlations, multivariate prediction, cross-project discussion, training, template materials and methodologies;
- output: evaluating KRIs, focused on a ‘customer’ point-of-view (how does this help me manage my business better), so that people learn from both successes and failures;
- monitoring: providing management information up to governors, over to customers, down to project managers and across project managers so that they are co-ordinated. Monitoring also uses feed-back from KRI outcomes to feed-forward into new KRI ideas and re-plan the shape of the KRI portfolio. An integral part of monitoring is evaluating KRIs at a technical level – do they predict? PKRI-LI prediction is one direction, and LI-PKRI is another.
The KRI System is a classic feed-back and feed-forward cybernetic system. KRIs help managers to manage by reducing the amount of measures they need in both feed-forward and feed-back. So the crucial distinction is between RIs and KRIs using PKRI-LI, as KRIs help to combat information overload:
“What information consumes is rather obvious: it consumes the attention of its recipients. Hence a wealth of information creates a poverty of attention, and a need to allocate that attention efficiently among the overabundance of information sources that might consume it.” [Simon 1971, pages 40-41]
By giving managers a clear focus on the operational risk drivers, they can commission further work to reduce them. The KRI system can be represented diagrammatically as:
So, in many ways, the PKRI-LI approach is a classic system dynamics approach, but the use of the SVM to link inputs (KRIs) with outputs (incidents and losses) focuses on establishing predictive relationships rather than presuming that the dynamic modelling paradigm is intrinsically important to either how those relationships are validated or how they are interpreted.
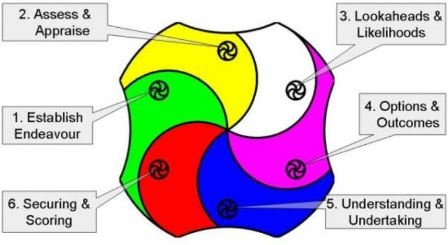
The PKRI-LI approach is a dynamic process, not a project to develop a static set of KRIs. This means that a team, possibly aligned with other ‘scientific’ management approaches such as 6Σ, need to be constantly cycling through an iterative refinement process over a time period. This leads to the development of cyclical methodologies. Z/Yen’s Z/EALOUS methodology is one such, and diagrammatically illustrated below:
What Is Current Practice? - Two Early Examples
Scientific management of wholesale financial operations is increasing. Investment banks have increased their operational benchmarking markedly since the late 1990’s. Managers in many investment banks (e.g. Bank of America, JPMorganChase, Citigroup and Merrill Lynch, amongst others, have publicly announced their pursuit of 6Σ) follow the DMAIC or DMADV 6Σ approaches (originally from GE) when they have losses/incidents that they want to eliminate by eliminating root-causes:
DMAIC - Existing Product/Process/Service
| Stage | Objectives |
|---|---|
| Define | Define the project goals and customer (internal and external) deliverables |
| Measure | Measure the process to determine current performance |
| Analyze | Analyze and determine the root cause(s) of the defects |
| Improve | Improve the process by eliminating defects |
| Control | Control future process performance |
DMADV - New Product/Process/Service
| Stage | Objectives |
|---|---|
| Define | Define the project goals and customer (internal and external) deliverables |
| Measure | Measure and determine customer needs and specifications |
| Analyze | Analyze the process options to meet the customer needs |
| Design | Design (detailed) the process to meet the customer needs |
6Σ is clearly related to a dynamic system view of the organisation, a cycle of tested feed-forward and feed-back. This had led to greater interest in using predictive analytics in operational systems management. Several leading investment banks, using 6Σ programmes and statistical prediction techniques (predicting trades likely to need manual intervention), have managed to reduce trade failure rates from 8% to well below 4% over three years for vanilla products. As the costs per trade for trades requiring manual intervention can be up to 250 times more expensive than trades with straight-through-processing transaction, this is a very important cost-reduction mechanism, as well as resulting in a consequent large reduction in operational risk.
Predictive analytics also feature where investment banks are moving towards automated filtering and detection of anomalies (dynamic anomaly and pattern response - DAPR) [Mainelli, October 2004]. Cruz [2002] notes that a number of banks are using DAPR approaches not just in compliance, but also as operational risk filters that collect “every cancellation or alteration made to a transaction or any differences between the attributes of a transaction in one system compared with another system. … Also, abnormal inputs (e.g. a lower volatility in a derivative) can be flagged and investigated. The filter will calculate the operational risk loss event and several other impacts on the organisation.” He continues, “the development of filters that capture operational problems and calculate the operational loss is one of the most expensive parts of the entire data collection process, but the outcome can be decisive in making an operational risk project successful.”
DAPR Support Vector Machine Example:
Contrasting a sub-set of actual versus predicted trade price bands
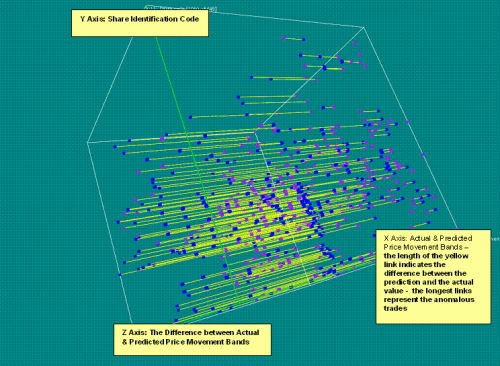
PKRI-LI aligns with this interest in using predictive analytics to improve operational management. While interest in the PKRI-LI approach may be rising, particularly among investment banks, there has been a paucity of data available for these purposes. As operational risk units are growing and developing data collection and measurement systems, PKRI-LI projects are growing in number.
European Investment Bank
One European investment bank used three years data to predict losses/incidents from data such as deal problems, IT downtime, and staff turnover over a six month period. It achieved reasonable predictive success, an R2 approaching 0.9 at times, though more frequently 0.6 (i.e. 60% of losses can be predicted). A high-level snippet gives a flavour of the data:
| Location ID | 1 | 2 | 3 | 4 |
| HR-Headcount # | 136 | 121 | 23 | 30 |
| HR-Joiners in month | 6 | 6 | 6 | 6 |
| HR-Leavers in month | 11 | 11 | 11 | 11 |
| IT-System Disruption Incidents | 2 | 2 | 0 | 0 |
| IT-System Downtime | 35:07:00 | 03:13 | 0 | 0 |
| FO-Trade Volume # | 19218 | 8999 | 661 | 4307 |
| FO-Trade Amendments # | 317.1 | 0 | 8.7 | 80.5 |
| OPS-Nostro Breaks # | 3 | 17 | 3 | 7 |
| OPS-Stock Breaks # | 9 | 4 | 0 | 1 |
| OPS-Intersystem Breaks # | 6 | 2 | 0 | 1 |
| OPS-Failed Trades # | 463 | 26 | 0 | 7 |
| OPS-Unmatched Trades # | 52 | 0 | 7 | 0 |
| RIS-Market Risk Limit Breaches # | 0 | 3 | 0 | 1 |
| AU-High Risk O/S Overdue Audit Issues # | 0 | 0 | 0 | 0 |
| AU-High Risk O/S Audit Issues # | 4.5 | 4.5 | 4.5 | 4.5 |
Note that some of the items in this snippet, e.g. HR joiners/leavers or IT disruption at the system level, can in practice be very hard to obtain. It was also noteworthy that, as a data-driven approach, PKRI-LI projects are only as good as the data put into them – “garbage in, garbage out”. In some areas, the data may not be at all predictive. More rigour needs to be used as the data becomes more important. Data quality can vary over time in hard-to-spot ways and interact with wider systems, particularly the people in the systems. For instance, in this trial of PKRI-LI, the IT department was upset at IT downtime being considered a “key risk indicator” and unilaterally changed the KRI to “unplanned” IT downtime, skewing the predicted losses. This change was spotted when using the DAPR system to run the reverse LI-PKRI prediction as a quality control. Another example of Goodhart’s Law, “when a measure becomes a target, it ceases to be a good measure” (as restated by Professor Marilyn Strathern).
Global Commodities Firm
A large global commodities firm active not only in a number of commodity markets but also foreign exchange and fixed income piloted the PKRI-LI approach in one large trading unit. While the predictive success was not especially great in the pilot, an R2 approaching 0.5, the approach was seen to have merit and they decided to roll the PKRI-LI methodology out globally across several business units. It was telling that the PKRI-LI approach helped them to realise the importance of good data collection and use, and to identify areas where there data specification, collection, validation and integration could be markedly improved. It is also important to note that the SVM approach did not add much value in the early stages, many of the predictive relationships were straightforward, e.g. large numbers of deal amendments can lead to later problems.
The PKRI-LI approach has become part of a more scientific approach (hypothesis formulation and testing) to the management of operational risk. “Modern [organization] theory has moved toward the open-system approach. The distinctive qualities of modern organization theory are its conceptual-analytical base, its reliance on empirical research data, and, above all, its synthesizing, integrating nature. These qualities are framed in a philosophy which accepts the premise that the only meaningful way to study organization is as a system.” [Kast and Rosenzweig in Open Systems Group, 1972, page 47]
Conclusion
At its root, Environmental Consistency Confidence means building a statistical correlation model to predict outcomes and using the predictive capacity both to build confidence that things are under control, and to improve. The correlations should raise good questions. KRIs are a continuous, evolving system, not static, hence the focus on the cyclical PKRI-LI approach. Today’s KRI should be tomorrow’s has-been as managers succeed in making it less of an indicator of losses or incidents by improving the business. Likewise managers have to consider emerging KRIs and validate them. Wholesale financial institutions can impress regulators with PKRI-LI, perhaps reducing regulatory overhead, but far more important is to use KRIs to improve their businesses and reduce operational risk.
References
- Beer, Stafford, Decision and Control: The Meaning of Operational Research and Management Cybernetics, John Wiley & Sons, 1966 (1994 ed).
- Boser, B., Guyon, I. and Vapnik, V., “A Training Algorithm for Optimal Margin Classifiers”, in Fifth Annual Workshop on Computational Learning Theory (COLT-92), pages 144-152, Pittsburgh, ACM (1992).
- Burbidge, Robert and Buxton, Bernard, “An Introduction to Support Vector Machines for Data Mining”, Keynote YOR 12 (Young Operational Research 11th Conference, University of Nottingham, 28 March 2001), Computer Science Department, University College London, Gower Street, WC1E 6BT, UK
- Cruz, Marcello G, “Modelling, Measuring and Hedging Operational Risk”, John Wiley & Sons, 2002.
- Howitt, Jonathan, Mainelli, Michael and Taylor, Charles “Marionettes, or Masters of the Universe? The Human Factor in Operational Risk” , Operational Risk (A Special Edition of The RMA Journal), pages 52-57, The Risk Management Association (May 2004).
- Mainelli, Michael “Toward a Prime Metric: Operational Risk Measurement and Activity-Based Costing” , Operational Risk (A Special Edition of The RMA Journal), pages 34-40, The Risk Management Association (May 2004).
- Mainelli, Michael, “Competitive Compliance: Manage and Automate, or Die”, Journal of Risk Finance, The Michael Mainelli Column, Volume 6, Number 3, pages 280-284, Emerald Group Publishing Limited (June 2005).
- Mainelli, Michael, “Finance Looking Fine, Looking DAPR: The Importance of Dynamic Anomaly and Pattern Response”, Balance Sheet, The Michael Mainelli Column, Volume 12, Number 5, pages 56-59, Emerald Group Publishing Limited (October 2004).
- Mainelli, Michael, Harris, Ian and Helmore-Simpson, Alan, “The Auditor's Cross Subsidy” (statistical modelling of audit prices), Strategic Planning Society E-Newsletter, Article 1 (June 2003). Also published as “Anti-dumping Measures & Inflation Accounting: Calculating the Non-Audit Subsidy”, www.mondaq.com (19 June 2003).
- Meyer, David, Leisch, Friedrich and Hornik, Kurt, “Benchmarking Support Vector Machines”, Adaptive Information Systems and Modelling in Economics and Management Science Report Series, Number 78, Vienna University of Economics and Business Administration (November 2002).
- Michie, D., Speigelhalter, D.J. and Taylor, C.C., Machine Learning, Neural and Statistical Classification, Ellis Horwood (1994), out of print – see http://www.amsta.leeds.ac.uk/~charles/statlog/.
- Open Systems Group, Systems Behaviour, Harper and Row, 1972, 3rd edn, 1981.
- Simon, Herbert A. (1971), “Designing Organizations for an Information-Rich World” in Martin Greenberger, ed., Computers, Communication, and the Public Interest, The Johns Hopkins Press, Baltimore.
- Vapnik, Vladimir N., Statistical Learning Theory, John Wiley & Sons (1998).
- Vapnik, Vladimir N., The Nature of Statistical Learning Theory, Springer-Verlag, New York (1995).
Thanks
I would like to thank Matthew Leitch, Justin Wilson, Ian Harris, Jürgen Strohhecker, Jürgen Sehnert and Christopher Hall for helping to develop some of the thinking behind this article, though not to claim they agree with all of it.
Professor Michael Mainelli, PhD FCCA FCMC MBCS CITP MSI, originally did aerospace and computing research followed by seven years as a partner in a large international accountancy practice before a spell as Corporate Development Director of Europe’s largest R&D organisation, the UK’s Defence Evaluation and Research Agency, and becoming a director of Z/Yen (Michael_Mainelli@zyen.com). Z/Yen was awarded a DTI Smart Award 2003 for its risk/reward prediction engine, PropheZy, while Michael was awarded IT Director of the Year 2004/2005 by the British Computer Society for Z/Yen’s work on PropheZy. Michael is Mercers’ School Memorial Professor of Commerce at Gresham College (www.gresham.ac.uk).
Michael’s humorous risk/reward management novel, “Clean Business Cuisine: Now and Z/Yen”, written with Ian Harris, was published in 2000; it was a Sunday Times Book of the Week; Accountancy Age described it as “surprisingly funny considering it is written by a couple of accountants”.
Z/Yen Group Limited is a risk/reward management firm helping organisations make better choices. Z/Yen undertakes strategy, finance, systems, marketing and intelligence projects in a wide variety of fields (www.zyen.com), such as developing an award-winning risk/reward prediction engine, helping a global charity win a good governance award or benchmarking transaction costs across global investment banks.
Z/Yen Group Limited, 5-7 St Helen’s Place, London EC3A 6AU, United Kingdom; tel: +44 (0) 207-562-9562.