Predicting The Effectiveness Of Grant-Making
By
Ian Harris, Professor Michael Mainelli, Peter Grant, Jenny Harrow
Published by Journal of Strategic Change, Volume 15, Number 2, John Wiley & Sons, pages 53-66.
Professor Michael Mainelli and Ian Harris, The Z/Yen Group
Professor Jenny Harrow and Peter Grant, CASS Business School Centre for Charity Effectiveness
[An edited version of this article first appeared as "Predicting the Effectiveness of Grant-Making", Journal of Strategic Change, Volume 15, Number 2, John Wiley & Sons (Mar-Apr 2006) pages 53-66.]
Expertise in monitoring and measuring effectiveness in the grant-funded sector has been developing and improving for several years. But can grant-making bodies improve their effectiveness by using predictive techniques to inform their decision making? This paper reports work with two UK grant-making bodies, the government-funded New Opportunities Fund (now incorporated into the Big Lottery Fund) and the longstanding independent grant-maker, City Parochial Foundation. The study used classification and prediction tools based on support vector machine mathematics to undertake predictive analysis of the data, the results of which were then compared with post hoc qualitative review by practitioners in the grant-making bodies. The study demonstrates statistically significant predictive capability for a New Opportunities Fund (NOF) programme but not for the City Parochial Foundation’s grant programme. These findings reflect significant procedural and cultural differences between the two grant-makers, although the differing quantities of data available for analysis in each case was also a factor. In particular, the pre-funding assessment processes and the post-project evaluation processes are significantly different. This paper suggests a model for distinguishing between types of grant-making body; it also assesses various procedural and cultural styles amongst grant-makers. Further, the paper demonstrates visualisation techniques that can be applied alongside predictive tools to help interpret the predictions. The paper indicates that predictive analytics can improve the funding effectiveness of relatively large, structured grant-making bodies. It also identifies areas for further research linking grant-making practice with organisations’ strategic decision making.
Context and questions
Expertise in monitoring and measuring effectiveness in the grant-funded sector has been developing and improving for several years. Much of this development reflects efforts to improve effectiveness measurement in the not-for-profit sector generally. Research in the UK indicates an increasing trend for not-for-profit organisations to provide tangible evidence of worth to justify their existence and funding [Harris, Mainelli and O’Callaghan, 2002]. This tangible trend contrasts with the largely unfulfilled aspiration to measure performance less than a decade earlier [Wise, 1995]. However, measuring performance in not-for-profit organisations is challenging [Stone and Gershenfeld, 2002] and often directed towards those output aspects that are relatively easily measured [Palmer, 2002] rather than the more difficult outcome and impact evidence generally sought by the practitioners [Harris, Mainelli and O’Callaghan, 2002]. Indeed, it is debateable the extent to which quantitative measurement of impact can be achieved; research in this field can be described as “part of an extended conversation” rather than a prescription [DiMaggio, 2002].
Grant making bodies (in the US primarily foundations, whilst in the UK a mixture of foundations and Government Agencies) form an important constituency in this debate or “conversation”. Grant makers are a major source of funding to charitable activity [NCVO, 2004]. The question “is this charitable activity effective” is then critically important to the funder of the activity, as well as the charitable body that undertakes the activity. It is unsurprising that grant makers question their own ability to measure impact and prove effectiveness [Balin, 2003], as well as that of their fundees.
This research resulted from several extended conversations between professionals at Z/Yen Limited, who have been consulting extensively with not-for-profit and commercial sector organisations for two decades, and academics at CASS Business School’s Centre for Charity Effectiveness. Wanting to build on existing research, such as the Evidence of Worth study [Harris, Mainelli and O’Callaghan, 2002] and Z/Yen’s award-winning work adopting support vector machine mathematics for business analysis [Mainelli, Harris and Helmore-Simpson, 2003], the conversations generated many interesting questions that might lend themselves to charity sector research, including fundraising effectiveness and efficiency of operational processes.
However, the measurement of outcomes and impact of charitable work was the area of mutual interest that we found most compelling. Grant-making bodies are especially interested in the effectiveness of charitable work, as they strive to justify their funding decisions on the basis of their achievement, as well as that of their funded bodies. Nevertheless, we knew of minimal evidence to show that grant-makers were using (or even considering) the kinds of predictive techniques widely used in business for investment and risk-based decisions as a means of testing and supporting their qualitative and often intuitive grant-making judgments. So we posed the following question:
Can grant-making bodies improve their effectiveness by using predictive techniques to inform their decision making?
We approached two UK grant-making bodies, The New Opportunities Fund (now a merged part of the Big Lottery Fund) and the City Parochial Foundation, for the opportunity to set up and follow through an experiment, exploring the outcomes of using predictive techniques in relation to a selection of their grant-making choices. As the former fund is government (at least indirectly publicly) financed, whereas the latter fund is privately financed, these organisations differed considerably in purpose, size and style. We shall discuss how those factors might influence our results and the usefulness of predictive techniques to different types of grant-making body in the analysis below.
Before we set out our analysis, we explain in the next three sections the tools, the experiment and the raw findings from the experiment.
The Tools
This study used classification and prediction tools based on support vector machine mathematics to undertake predictive analysis of the data. Organisations can frequently benefit from using historic data to predict future events in real-time, but in practice organisations have rarely done so, because predictive software has traditionally been expensive to develop.
Support Vector Machines (SVMs) are algorithms that develop classification and regression rules from data. SVMs result from classification algorithms first proposed by Vladimir Vapnik in the 1960’s, arising from his work in Statistical Learning Theory [Vapnik, 1995, 1998]. SVMs are based on some wonderfully direct mathematical ideas about data classification and provide a clear direction for machine learning implementations. While some of the ideas behind SVMs date back to the 1960’s, computer implementations of SVMs did not arise until the 1990’s with the introduction of a computer-based approach at COLT-92 [Boser, B., Guyon, I. and Vapnik, V., 1992].
SVMs are now used as core components in many applications where computers classify instances of data (e.g. to which defined set does this group of variables belong), perform regression estimation and identify anomalies (novelty detection). SVMs have been successfully applied in time series analysis, reconstructing chaotic systems and principal component analysis. SVM applications are diverse, including credit scoring (good or bad credit), disease classification, handwriting recognition, image classification, bioinformatics and database marketing, to name a few.
SVMs are said to be independent of the dimensionality of feature space as the main idea behind their classification technique is to separate the classes in many data dimensions with surfaces (hyperplanes) that maximise the margins between them, applying the structural risk minimisation principle. The data points needed to describe the classification algorithmically are primarily those closest to the hyperplane boundaries, the “support vectors”. Thus, only a small number of points are required in many complex feature spaces. SVMs can work well with small data sets, though the structure of the training and test data is an important determinant of the effectiveness of the SVM in any specific application.
SVMs compete forcefully with neural networks as well as other machine learning and data mining algorithms as tools for solving pattern recognition problems. Where SVMs do not perform well it is arguable that the algorithmic rules behind the support vector algorithm do not so much reflect incapabilities of the learning machine (as in the case of an overfitted artificial neural network) but rather regularities of the data. In short, current opinion holds that if the data in the domain is predictive, SVMs are highly likely to be capable of producing a predictive algorithm. Importantly, SVMs are robust tools (understandable implementations, simple algorithmic validation, better classification rates, overfitting avoidance, fewer false positives and faster performance) in practical applications. “The SVM does not fall into the class of ‘just another algorithm’ as it is based on firm statistical and mathematical foundations concerning generalisation and optimisation theory” [Burbridge & Buxton, 2001]. However, comparative tests with other techniques indicate that while they are highly likely to be capable of predicting, in applications SVMs may not be the best approach for any specific dataset. “In short, our results confirm the potential of SVMs to yield good results, especially for classification, but their overall superiority cannot be attested” [Meyer, Leisch, Hornik, 2002].
PropheZy and VizZy are two software packages developed by Z/Yen for classification and visualisation of data. PropheZy implements a SVM on a server (though it can be used in a local client/server mode). Naturally, as in any field of computing, there are a number of variant SVM implementations, of which PropheZy implements three types - C-SVC, nu-SVC and binary. Further, of statistical importance in replicating results is the “kernel function”. PropheZy implements four types of kernel function - linear, radial basis function, sigmoid and polynomial. The SVM types and kernel function types are described in detail in Vapnik [1995, 1998]. For this study, the SVM implementation used was C-SVC and the kernel function was linear.
So far, the PropheZy server SVM has been implemented on a Linux server, a Sun Solaris server and a Windows NT server. PropheZy implements the user-interface to the server SVM via XML (extensible mark-up language). The XML user-interface can be via an HTML page, directly through a bulk file loader command line or by use of an Excel add-in that performs XML data submission from spreadsheets to the server SVM and displays results back in Excel spreadsheets. For this study, the PropheZy implementation was the Excel add-in using the Windows NT server. VizZy provides clustering, histogram, Voronoi and data cube diagrams from tabular data.
Z/Yen has benchmarked PropheZy against standardised machine learning tests, e.g. appropriate StatLog test sets [Michie, Spiegelhalter and Taylor, 1994], in order to validate the SVM with good to excellent results. In industrial application, Z/Yen has trialled PropheZy extensively in financial services applications and sees great promise for SVMs and other Dynamic Anomaly and Pattern Response (DAPR) techniques in areas such as compliance [Mainelli, 2005], trade anomaly detection and scorecards [Mainelli, 2004] as well as regression and value prediction [Mainelli, Harris and Helmore-Simpson, 2003].
The Experiment
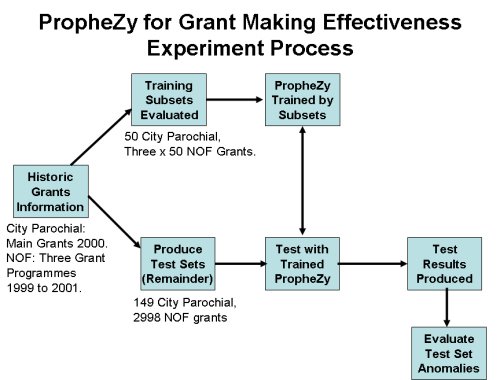
Two grant making bodies, City Parochial Foundation and the New Opportunities Fund (NOF) participated. The following diagram illustrates the experiment process for predicting grant making effectiveness using PropheZy.
In order to test for effectiveness, we devised three post-hoc evaluation questions that can be reasonably asked of any funded project and organisation:
- Did the funded work mostly achieve its objectives?
- With the benefit of hindsight, was it the right decision to have funded that work?
- Did you fund that organisation again or (if not) would you recommend funding it again?
While these questions do not cover every nuance of effectiveness, they serve as solid, generic questions that can be asked of any funded endeavour. If one or more of these questions is answered “no”, there must be some reservation with regard to the effectiveness of the grant and/or some problem with that funding transaction. However, we recognised the qualitative nature of our classifications (an evaluator’s assessment of whether a question should be answered yes or no is far more subjective than, say, a banker’s assessment of whether a derivative transaction has failed to complete or not). One of the key areas which we wanted to test was whether SVMs could yield useful results from subjective classification data, such as the above questions.
With City Parochial Foundation, we looked at all projects that had been funded through the Foundation’s main trust in the year 2000. This produced a data set of 199 funded projects all of which had run their course sufficiently to enable City Parochial Foundation evaluators to answer the post-hoc analytical questions posed. City Parochial Foundation does not gather extensive data for each grant through standardised forms, rather the standardised elements remain minimal while each application that passes the initial hurdle receives a visit from an assessor who writes a qualitative report on the applicant organisation and the application itself. The data set yielded 16 analytical fields per grant (although not all fields would be used for each grant). The analytical fields were, in summary:
- Legal category;
- Area of benefit:
- Charity turnover;
- Number of part-time workers:
- Number of full-time workers;
- Major funding category;
- Total grant;
- 9 fields to set out the payment instalments for the grant.
With NOF, we looked at three programmes of work that had been funded between 1999 and 2001:
- Community Access to Lifelong Learning (1,709 grants);
- Digitisation (179 grants);
- Healthy Living Centres (1,260 grants).
In contrast to City Parochial Foundation, NOF gathered substantial structured information from each applicant at application time and would rarely use visits and qualitative reporting as part of its decision-making model. The data set yielded 35 analytical fields per grant (although not all fields would be used for each grant). These 35 analytical fields are common to all three programmes of work considered for this study. The analytical fields were, in summary:
- Organisation status code;
- Project aimed at male gender?
- Project aimed at female gender?
- Project aimed at age?
- Project aimed at ethnicity?
- Project aimed at disability?
- Project aimed at religious group?
- Number of full-time employees;
- Number of part-time employees;
- Number of full-time volunteers;
- Number of part-time volunteers;
- Total number of potential beneficiaries;
- Grant length;
- Several geographical analysis fields;
- 16 financial fields analysing the capital, revenue, instalment and partnership funding characteristics of the funding.
These contrasting styles of organisation and decision-making processes would provide very different data sets. We knew from other SVM work that large data sets are not a prerequisite for spotting patterns in data. However, we suspected that the smaller data set combined with far fewer variables for analysis would make the City Parochial data set more challenging to SVM analysis than the NOF data.
In order to test a data set, the SVM needs to be trained on a set of data with the same variables. 50 of the City Parochial Foundation grants and 50 grants from each of the three NOF programmes were randomly chosen and allocated to assessors who were asked to answer the three post hoc evaluation questions for each of those grants. Those sets of 50 grants are described as the training data sets.
PropheZy was trained with the 50 City Parochial grants for the City Parochial experiment and with the 150 NOF grants for the NOF experiment. We were able to treat the NOF data as a single data set, as the variables used for each of the programmes were identical.
We then tested the remaining data for each of the organisations using its training data set for each experiment – 149 grants for City Parochial Foundation and 2998 grants for NOF. Where PropheZy yielded a “no” answer to one or more of the three post hoc questions for a particular grant, we deemed that result to be an anomaly. We then asked assessors to report if there had been any effectiveness issues or problems with that grant and to report the nature of any difficulties.
Findings and follow up – City Parochial Foundation
For City Parochial Foundation, we were working with a relatively small data set and relatively few variables. Although SVM can be effective with relatively small data sets, the City Parochial Foundation training set proved problematic, because very few of the 50 training set grants had “no” answer assessments. “Did the funded work mostly achieve its objectives?” was answered with 47 “yes” and 3 “no” responses. “With the benefit of hindsight was it the right decision to have made the grant?” Was answered with 48 “yes” and 2 “no” responses. Evaluators insisted that City Parochial Foundation’s intensive pre-grant screening meant that very few grants were ineffective or problematic. We tried to ensure that we had sufficient “no” answers in the training set by using the question “did you fund again?” rather than “did or would you fund again?”, yielding 23 “yes” and 27 “no” responses, but there can be various reasons why there is no further funding, not just lack of effectiveness or difficulties, so there are unlikely to be patterns from that sleight of hand; indeed PropheZy found none in the data.
We then tried a further sleight of hand by insisting that, in addition, the evaluators rate the projects against each of the questions as A, B, or C (A being high quality, B being medium, C being lower quality, with a requirement to allocate roughly equal numbers (17 or 18) to each category for each question. Rating proved to be unpopular with the evaluators. Some claimed to find the distinction arbitrary and/or felt that they were being forced to rate a project incorrectly because of the enforced allocation. Nevertheless, this approach does simulate the sort of “triage” approach that might be required for optimisation in times of shortage. We set PropheZy to look for patterns indicating “C” (lower quality) grants, and PropheZy did identify some patterns in the test set this time. The number of “C” answers for each question is shown in the following table.
Table 1: SVM Predictions for City Parochial Foundation "C" (Comparatively Low Rated) Grants
| Question | Number of "C" answers predicted by PropheZy | Comment |
|---|---|---|
| Did the funded work mostly achieve its objectives? | 5 (3.3%) | Well below the 33% of “C” answers in the training set. |
| Was it the right decision to have made the grant? | 10 (6.7%) | Well below the 33% of “C” answers in the training set. |
| Would you recommend funding again? | 22 (14.8%) | Probably higher than others due to the larger number of “no” answers to “did you fund again” question, but still well below 33% used in training set. |
When the evaluators looked at the grants concerned, they rated one of the predicted “C” answers “A”, 16 of them “B”, 5 of them “C” and were unable to respond on 15 of them. They reported finding the exercise difficult; in particular stating that the type of work they like to fund “would be difficult to categorise and quantify”. Sioned Churchill, who co-ordinated the City Parochial Foundation responses, said “It would appear that PropheZy is not entirely compatible with our style of grant-making, This may be because each grant application is assessed by a Field Officer who will take account of many variables……”, i.e. not just those recorded on the formal application.
We can take some crumbs of comfort from the City Parochial findings; PropheZy did identify patterns even in this small, somewhat qualitative data set. In only one case did PropheZy predict “C” (lower rated) while the evaluator predicted “A” (higher rated).
However, it is difficult to imagine City Parochial Foundation or another foundation of its size and style finding this form of analysis particularly useful.
Findings and follow up – New Opportunities Fund (Big Lottery Fund)
The NOF data provided a much larger data set with more variables than City Parochial Foundation. However, the evaluators at NOF shared the City Parochial Foundation evaluators’ reluctance to answer the post hoc evaluation questions “no”. Table 2 below sets out the number of “no” answers allocated to each question for each training data set.
Table 2: Evaluator Responses "No" to each of the Post Hoc Questions Based on a Random Sample of Grants for each New Opportunity Fund Programme in the Experiment
| Question | Community Access to Lifelong Learning | Healthy Living Centres | Digitisation |
|---|---|---|---|
| Number of grants in training data set | 51 | 54 | 49 |
| Did the funded work mostly achieve its objectives? | 6 (11.8%) | 1 (1.9%) | 0 (0%) |
| Was it the right decision to have made the grant? | 10 (19.6%) | 2 (3.7%) | 4 (8.2%) |
| Would you recommend funding again? | 11 (21.6%) | 6 (11.1%) | 5 (10.2%) |
The overall percentage of “no” answers, 9.7%, is low but contained enough records to give some confidence that the SVM should be able to learn enough to produce some results. With the benefit of hindsight, we should have asked for a larger training set had we known that the results would be so strongly skewed towards “yes” answers. The beauty of the SVM approach when used in real situations, however, is that you can use the ongoing results for further statistical learning and therefore should get improving results as the training set grows.
As there were only 7 “no” answers (4.5%) in the training set to the question “did the funded work mostly achieve its objectives?” it was unsurprising that PropheZy did not find any patterns in the test set suggesting a “no” answer to that question. However, PropheZy did find 41 grants where it anticipated the answer “no” to the “would you recommend funding again?” question, for 18 of which it also predicted the answer “no” to the question “was it the right decision to have made the grant?”.
Evaluators were asked to assess the grants that PropheZy had flagged up as anomalies. Of the 41 grants, 11 were still at too early a stage to tell or for other reasons it was not possible to evaluate them. Of the 30 grants which did lend themselves to evaluation, 15 were indeed evaluated as anomalies, 15 were not. Most of the anomalies came from the Community Access to Lifelong Learning (CALL) programme, which indeed had yielded the most “no” answers in the training set (see Table 2 above). Indeed, all of the 30 which lent themselves to evaluation were from that programme.
We can assume that the random sample used for the training set represents the population of CALL programme grants. The size of the training sample is 51 grants and 13 of those grants (25.5%) had one or more “no” answers. Our hypothesis is that PropheZy findings (50%) are significantly higher than a random sample (25.5%). The standard error of that population is 0.061 (the square root of [{0.255*0.745}/51]). We can be 99% sure that a random sample of 51 responses would yield between 10% and 40% anomalies.
Although the results sample of 30 is small, we can test the significance of the result by using significance testing on sampling proportions for the CALL programme. The standard error of the results sample is 0.0913 (the square root of [{0.5*0.5}/30]). The difference between the PropheZy percentage and the population percentage is over 2.5 standard errors – i.e. we can be 99% confident that the Prophezy sample is significantly different from the random sample, even on such a small sample.
Ideally, we would have liked to do some further experiments using larger samples of data and in particular providing PropheZy with more training set data upon which to base its predictions. However, the merger of NOF with the Community Fund to form the Big Lottery Fund made it impractical for the NOF team to undertake further experiments with us at this time. However, even an ability to find anomalies using a predictive technique with 50% accuracy is encouraging, especially as the experimental sample was small and we would anticipate PropheZy’s capability to improve with additional training data. Thus we would expect detection rates to increase, which would reduce the number of false negatives (40 out of 1600 is a 2.5% detection rate from a sample where 25% anomalies might be found). Also, accuracy rates should increase as the training sample increases, although 50% false positives is manageable in the circumstances, as an anomaly rating from PropheZy should result in some additional checking of a grant application, not its rejection. Therefore the downside of a false positive, some additional review work prior to making a grant, is a small matter compared with the upside of a true positive – the reshaping or rejection of a grant that would otherwise be ineffective.
Interpreting the Predictions
We examined the NOF anomaly data in VizZy to see if there were visible patterns in the data that could help our interpretation of PropheZy’s findings. VizZy allows several views on data as described in “The Tools” above. Given the number of variables in the NOF data, the data cube and Voronoi diagrams are unlikely to yield patterns that can be interpreted easily by the human eye. If the anomaly data were highly clustered, the cluster diagram might provide useful insight into the patterns, but this did not seem to be the case with the NOF data.
Only the histogram view seemed to illustrate visible patterns in the anomalies. Many of the anomalies had high numbers of part-time volunteers, many of the anomalies had high recommended grant values (which might affect the response to the “would you fund again?” question) and the anomaly grants tended to have medium lengths in years, suggesting that short duration grants and grants for longer-term work are less likely to be anomalies.
Diagram 1 below shows the NOF anomaly data in the Profiling Display view of VizZy.

Given the small sample size involved and the fact that the SVM is using a great many variables, the visual interpretation is likely to be somewhat simplistic. However, the visible patterns described might be worth investigating in more detail for some data sets.
Conclusions Regarding Types of Grant Maker
There were significant procedural and cultural differences between the two grant-makers, which impacted upon the results of our experiment, and the responses by colleagues within these organisations to the process of the experiment. At a procedural level, pre-funding assessment is done in strikingly different ways. At City Parochial Foundation, all applications that pass an initial “desk evaluation” for eligibility and suitability are subject to a hands-on, bespoke process of evaluation which normally leads to the shaping and making of a grant. City Parochial Foundation people believe that this up-front, hands-on approach leads to very low anomaly rates.
Such an approach would be impractical for a large funder with a diverse portfolio of programmes, such as NOF. NOF ran an exceptionally large number of different programmes simultaneously, close to 100, as opposed to probably no more than 10 or 12 in most other large funding bodies. This high volume and diversity of programmes meant that conventional staff resource ratios were unsustainable. Rough staffing ratios of other grant-makers (both in the UK and the US) are around one member of operational staff to every £500,000 to £1m of grant. NOF staffing ratios needed to be around one member of operational staff to every £2m to £4m of grant, to keep administrative costs to a reasonable proportion of income. In order to achieve those administrative cost targets, desk-based assessment needed to be the cornerstone of the pre-funding grant-making process at NOF.
It was therefore a key task at NOF to examine potential ways of augmenting the human element in grant-making without detracting from either service to grantees or standards of public accountability. Indeed, it was the potential of PropheZy to augment the human element in grant-making that attracted NOF to participate in this research project with Z/Yen and Cass.
Post-funding evaluation also differed between the organisations. At City Parochial Foundation, post-funding assessment would normally be conducted by the same person who undertook the pre-funding assessment. This reflects City Parochial Foundation’s size and the resulting difficulties in segregating duties to any significant degree, although City Parochial Foundation does ensure that its regular monitoring reports go to an assessor and a monitoring and evaluation officer. For the purposes of our experiment, City Parochial Foundation allocated projects for grading randomly. Nevertheless, City Parochial Foundation has relatively low staff turnover and a relatively small team, so it was more likely at City Parochial Foundation that the grants officer who made the grant was assessing the effectiveness of that grant some years later. At NOF, it is far more likely that post-grant assessment is undertaken by a different member of staff for policy reasons (to segregate the duties) or for practical reasons (owing to staff turnover). Similarly, for our experiment, few if any NOF projects will have been assessed by the grants officer who originally approved the project. There are benefits to both approaches; continuity of involvement being a key benefit of the City Parochial model, semi-independent assessment being a key benefit of the NOF model.
It would then be possible to construct two plausible hypotheses based on either the pre-assessment or post-assessment differences:
- City Parochial Foundation’s hands-on pre-assessment techniques ensure that anomalies are almost always rejected or reshaped prior to making a grant, which explains the low anomaly rates reported for our research. NOF’s standardised, hands-off approach, in common with most high-volume grant-makers, is likely to result in higher anomaly rates;
- NOF’s independent (or semi-independent) post-hoc evaluation techniques ensure that anomalies are identified and flagged up for learning. It is difficult for the individual who recommended a grant to subsequently flag up that a grant was anomalous, especially if that individual used hands-on techniques for pre-assessment, as is the case at City Parochial Foundation. Anomalies might, therefore, be under-reported in the absence of independent or semi-independent post-hoc evaluation.
These hypotheses could (and perhaps should) be the subject of an entire research project of some scale, so we shall not explore them further here. For the purposes of this study, it matters little whether either or both of those hypotheses is true. The key point for this study is that predictive techniques using SVM show promise in the NOF-type situation, which therefore would be likely to apply to large, structured grant-makers in both the charity and public sector, whereas it does not show promise in the smaller, hands-on pre-assessment world of City Parochial Foundation and other similar grant-making bodies.
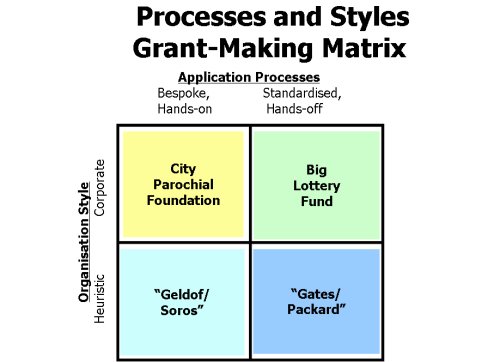
Initial reaction from staff involved in the project (at both City Parochial Foundation and NOF) varied from fascinated interest to heavy scepticism that a mathematical tool could be of help in such a subjective area. This varied staff response reflects a wider debate in grant-making as to whether the subject is more of an ‘art’ (more akin to poetry and based on inspiration) or a ‘science’ (more akin to architecture or business – funding as a considered investment for a social purpose). Although this research has highlighted significant differences in processes between City Parochial Foundation and NFO, in fact both organisations share a business-like or corporate style. While we have emphasised City Parochial Foundation’s hands-on, bespoke pre-assessment and the continuity of involvement from grants officers, these models are deployed in a consistent, standardised way. Assessment criteria are well-established and applied with rigour in both organisations. In short, they are both ‘corporate’ in style.
There is an alternative style of grant-making body, which can be called heuristic rather than corporate. Often characterised by an entrepreneurial, benevolent individual, that entrepreneur’s business style strongly influences the foundation. This distinction between corporate culture and entrepreneurial, heuristic culture has been the subject of extended discussion in business management theory [Hofstede, 1980], [Trompenaars & Hampden-Turner, 1997]. Such bodies can display either the bespoke, hands-on process characteristics akin to City Parochial Foundation or the more standardised, hands-off process characteristics akin to Big Lottery Fund. Diagram 2 below illustrates the matrix of different styles and different processes, with some illustrative names suggested as examples for the four main types of grant-making bodies.
Conclusions Regarding Predictive Analysis for Grant-Makers
Predictive analysis is probably likely to be most effective:
- In public grant-makers where accountability and transparency requirements are higher, and where the addition of an extra ‘filter’, especially one that is ‘objective’, could be a further check on inappropriate use of public funds;
- In high volume programmes where resources are at a premium and so detailed checking or analysis by highly trained staff may not be available;
- When organisational risk is a high priority or investment is being made in organisations rather than projects (e.g. ‘capacity building’). There is an increasing emphasis on this aspect of grantmaking in the UK (e.g. Futurebuilders, Capacity Builders and the Big Lottery Fund’s subsequent voluntary sector programmes) and so predictive analysis could become a useful additional tool in tracking organisational performance over time and spotting the potential for investment or discrepancies;
- Where the concept of ‘social return on investment’ is understood and where there is an interest in measuring it. In other words in those grant-makers that accept that funding is a business and take a more ‘scientific’ approach to the subject;
- Where one is considering programme related investment, loans or a version of venture philanthropy. In each case this is where grant-making most closely approaches business investment and, again, indicators pf potential organisational success or failure will be at a premium.
By extension there are a number of grant-making problems or areas where predictive analysis might contribute even more, although these areas have not been tested as part of this research:
- Enhancing knowledge management systems or contributing to learning. Predictive analysis might provide longer-term monitoring of organisations funded by grant-makers. This could have potential benefits for both funders and grantees. A more extensive and comprehensive organisational profile of funded organisations could be built up which would reduce the requirement for organisations’ to keep duplicating information every time they apply to a new funder or under a new programme and cut down on the time required by the grant-maker to assess organisational capacity or risk;
- Sharing information between funders and partnerships. Over time established organisations would develop a ‘funding profile’ that could be shared with others (and be totally transparent and public). Grant-makers are beginning to explore exactly how to share knowledge and predictive analysis could play a useful part in this;
- Enhancing risk or fraud management systems, especially in high volume programmes. Recent events have brought to light the vulnerability that larger volume grant programmes (and even some smaller ones) have to systematic fraud. Predictive analysis could play a potentially critical part in detecting this. To date IT based anti-fraud measures (such as the MACRS system formerly used by the UK Lottery distributors) have proved unworkable in the longer-term. As they are based on a simple process of ‘field matching’ they throw up hundreds of matches and provide no means of sorting these into those that are entirely innocent from those requiring more detailed investigation and this problem only increases over time as the amount of data in the system grows and more ‘false positives’ are identified. Predictive analysis would be likely to provide a simple and effective alternative and one that, in complete contrast to the systems used to date, becomes more effective as more data is available.
Although predictive analysis is still only another ‘tool in the bag’ and should not be used as a substitute for the human element in grant-making, it has real potential to contribute to risk-based grant-making processes. Predictive analysis might form an important element of an IT-based knowledge management system that would help eliminate unnecessary duplication of organisational competence. Predictive analysis might also provide a significant safeguard against fraud at a time when grant-makers may be in need of efficacious solutions.
Further work with suitable grant-making bodies, i.e. the benefit of experience, should improve our ability to use predictive analytics for grant-making effectiveness. This study suggests that predictive analytics could significantly improve the performance those grant-making bodies, and points to the importance of continuing this work beyond this experimental stage.
Acknowledgments
We express our grateful thanks to colleagues in the City Parochial Foundation and the New Opportunities Fund for their participation in our research.
An earlier version of this paper was presented by Ian Harris and Peter Grant at the ESRC Research Seminar series on ‘grant-making and grant-makers’, held at Cass Business School in June 2005. and we are grateful to seminar participants’ contributions.
Sources
Balin, Michael A., “Requestioning, Reimagining and Retooling Philanthropy”, Nonprofit and Voluntary Sector Quarterly, Vol 32, No 4, (December 2003).
Boser, B., Guyon, I. and Vapnik, V., “A Training Algorithm for Optimal Margin Classifiers”, in Fifth Annual Workshop on Computational Learning Theory (COLT-92), pages 144-152, Pittsburgh, ACM (1992).
Burbidge, Robert and Buxton, Bernard, “An Introduction to Support Vector Machines for Data Mining”, Keynote YOR 12 (Young Operational Research 11th Conference, University of Nottingham, 28 March 2001), Computer Science Department, University College London, Gower Street, WC1E 6BT, UK - http://www.orsoc.org.uk/conf/previous/yor12/Keynote - Robert Burbidge.doc.
Harris, I., Mainelli, M. and O’Callaghan, M., “Evidence of Worth in Not-for-Profit Sector Organisations”, Strategic Change, Volume 11, pages 399 to 410, December 2002.
Hofstede, Geert, Culture's Consequences, Sage Publications, 1980.
Mainelli, Michael, “Competitive Compliance: Manage and Automate, or Die”, Journal of Risk Finance, The Michael Mainelli Column, Volume 6, Number 3, pages 280-284, Emerald Group Publishing Limited (June 2005).
Mainelli, Michael, “Finance Looking Fine, Looking DAPR: The Importance of Dynamic Anomaly and Pattern Response”, Balance Sheet, The Michael Mainelli Column, Volume 12, Number 5, pages 56-59, Emerald Group Publishing Limited (October 2004).
Mainelli, Michael, Harris, Ian and Helmore-Simpson, Alan, “The Auditor's Cross Subsidy” (statistical modelling of audit prices), Strategic Planning Society E-Newsletter, Article 1 (June 2003). Also published as “Anti-dumping Measures & Inflation Accounting: Calculating the Non-Audit Subsidy”, www.mondaq.com (19 June 2003).
Meyer, David, Leisch, Friedrich and Hornik, Kurt, “Benchmarking Support Vector Machines”, Adaptive Information Systems and Modelling in Economics and Management Science Report Series, Number 78, Vienna University of Economics and Business Administration (November 2002).
Michie, D., Speigelhalter, D.J. and Taylor, C.C., Machine Learning, Neural and Statistical Classification, Ellis Horwood (1994), out of print – see http://www.amsta.leeds.ac.uk/~charles/statlog/.
NCVO, “The Size And Scope Of The UK Voluntary Sector: NCVO’s UK Voluntary Sector Almanac”, NCVO, 2004.
Palmer, P., “Performance Measurement and Accountability in the Charity Sector – Evaluation of Existing Practice and Recommendations for Future Development”, A Research Report for the Institute of Philanthropy, University College London, 2002.
Trompenaars, Fons and Hampden-Turner, Charles, Riding the Waves of Culture: Understanding Cultural Diversity in Business, Nicholas Brealey Publishing Limited, 1997.
Vapnik, Vladimir N., The Nature of Statistical Learning Theory, Springer-Verlag, New York (1995).
Vapnik, Vladimir N., Statistical Learning Theory, John Wiley & Sons (1998).
Wise, David, Performance Measurement for Charities, ICSA Publishing (1995)
Ian Harris leads Z/Yen’s not-for-profit sector practice. Ian specialises in strategic planning, systems design, rewards planning and organisational change. Not-for-profit sector clients include The Children’s Society, Barnardo's, The National Trust, Cancer Research UK, Women’s Royal Voluntary Service, BEN, Macmillan Cancer Relief, British Heart Foundation, The Marine Stewardship Council, UNISON, NSPCC and The British Red Cross. Ian is also a regular contributor of articles and pieces for the business and not-for-profit press. He is co-author, together with Michael Mainelli, of the practical book "IT for the Not-for-Profit Sector" and the best-selling novel "Clean Business Cuisine".
Professor Michael Mainelli is Z/Yen Chairman and leads its High Technology Sector work. Michael has worked in a variety of sectors (banking, insurance, media, utilities, television, distribution as well as not-for-profit organisations) on problems ranging from strategy through information systems, quality, human resources and performance improvement. Michael is a former Vice-Chairman of The Strategic Planning Society. Michael was a partner in a large international accountancy practice for seven years before a spell as Corporate Development Director of Europe’s largest R&D organisation, the UK’s Defence Evaluation and Research Agency, and becoming a director of Z/Yen. He is the Mercers’ School Memorial Professor of Commerce at Gresham College.
Peter Grant is Senior Visiting Fellow in the Centre for Charity Effectiveness and academic leader of the MSc in Grantmaking Management. Peter worked in the Arts and then as director of an inner city charity for eight years. He joined Sport England at the inception of the National Lottery where he was respectively Deputy Director of Operations and then Head of Public Affairs and Development. From 1999 to 2004 he Director of Operations of the New Opportunities Fund.
Professor Jenny Harrow is Professor of Voluntary Sector Management in the Centre for Charity Effectiveness. Jenny leads the Centre’s research interests in voluntary and community sector organisations. She is also a member of the Faculty of Management’s Centre for Corporate Governance. Jenny has held a range of London-based posts in the voluntary sector and is an active trustee board member of a South London university settlement and a grantmaking trust. She was most recently Professor of Management, in London South Bank University Business School, where she directed the School’s doctoral programme and co-led the Centre for Government and Charity Management.
CASS Business School Centre for Charity Effectiveness is developing a research portfolio emphasising work which is primarily problem-based and empirically oriented. It includes funded and commissioned studies from independent policy groups, professional and public bodies. The Centre is also active in the national and international research networks for academic studies in non-profits. (http://www.cass.city.ac.uk/cce/).
Z/Yen Limited is a risk/reward management firm working to improve organisational performance through successful management of risks and enhancement of rewards. Z/Yen undertakes strategy, systems, people, intelligence and organisational change projects in a wide variety of fields (www.zyen.com).