Best Execution Compliance Workstation Project
Background
Best Execution Compliance Workstation Helping Brokers Comply with MiFID
The European Union’s Markets in Financial Instruments Directive (MiFID) Article 21 placed an obligation on brokers from 1 November 2007 to “execute orders on terms most favourable to the client” - ‘best execution’. Most brokers rely on traditional management oversight of the trading process or sampling, neither of which can cope with today’s volumes. What’s missing is the ability to show that a specific trade was executed at a reasonable price. The only effective method of monitoring hundreds of thousands of trades per week is to have an automated process identifying a sensible set of anomalous trades for examination. Basically, firms need a ‘sifting engine’ that identifies potentially anomalous trades – ‘best execution compliance automation’.
“Member States shall require that investment firms take all reasonable steps to obtain, when executing orders, the best possible result for their clients taking into account price, costs, speed, likelihood of execution and settlement, size, nature or any other consideration relevant to the execution of the order. … Member States shall require investment firms to monitor the effectiveness of their order execution arrangements and execution policy in order to identify and, where appropriate, correct any deficiencies.”
In the USA, a similar set of regulations from the SEC, RegNMS, takes effect in 2006 and also requires the ability to demonstrate best execution. The Financial Services Authority advises (“Planning for MiFID”, November 2005, Page 12):
“Firms will need to consider how they will monitor execution performance by the venues included in their policy, and their processes for determining which execution venues to use. They will need to consider the extent to which their existing trading strategies enable them to deliver on these obligations. This could have systems impacts for some firms and generate wider demand for data relating to executions.”
Most brokers rely on traditional management oversight of the trading process or customer feed-back to control execution quality – but traditional oversight cannot cope with today’s volumes and clients tend to feed back selectively. Many brokers contrast prices obtained in a sample of trades (1% may be typical according to the British Bankers’ Association) with the published bid-offer spreads available at the time – but then complain that the bid-offer spreads are only a good comparison for very small trades.
What’s missing is the ability to show that a specific trade was executed at a reasonable price taking into account the various characteristics of the trade. In order to comply with MiFID, the only effective method of monitoring thousands or hundreds of thousands of trades per week is to have an automated process identifying a sensible set of anomalous trades for individual examination. Basically, firms need a ‘sifting engine’ that puts forward trades that must be examined – “best execution compliance automation”.
In 2004 Z/Yen undertook an informal trial of its PropheZy risk/reward prediction software on bid-offer spreads for the small-cap trades of a broker. PropheZy is a commercial application of a Support Vector Machine (SVM). This trial indicated that PropheZy might be good at identifying trading anomalies for compliance purposes.
Best Execution Compliance Automation (BECA) Project
Z/Yen, in co-operation with Sun Microsystems, the London Stock Exchange and five leading brokers, completed a large, formal research study to trial PropheZy in 2005– a commercial application of a support vector machine. Using three months of data comprising over 190,000 trades with a value of over £54bn in order to predict a fourth month, the objective was to see if PropheZy could predict the likely price range of a trade (specifically one of twenty price movement bands, based on a logarithmic scale).
The project proved that PropheZy successfully predicted price movement bands. Setting the level of acceptable accuracy at “within 0 to 4 bands” out of 20, PropheZy was able to predict over 50% of the trades price bands acceptably.
Chart 1
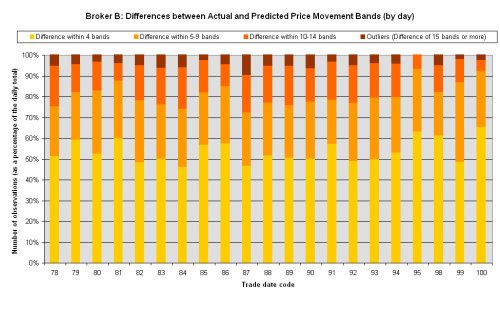
The project proved that the PropheZy system successfully predicted price movement bands. For instance, by setting the level of acceptable accuracy at “within 0 to 4 bands” out of 20 [Chart 1], i.e. one quarter of the logarithmic scale, PropheZy was able to predict over 50% of the trades price bands acceptably. Using these predictions, it was possible to set a level for best execution outliers or anomalies using price band prediction differences.
An outlier, or anomalous trade, was defined as a trade where the predicted price movement differs from the actual price movement by more than 15 bands out of 20 – either a very high price movement was predicted but a low price movement was observed, or a very low price movement was predicted but a high price movement was observed.
Table 1 below indicates that when using the SVM as an initial filter [First Filter] on average 7% of non-SETS trades are defined as outliers. 7% is still too many outliers for a detailed manual investigation. A second filter is therefore needed. A trade is unlikely to fail best execution if it was conducted at the best prevailing price (or better), though there are some arguments that very large trades might be capable of exceptional improvement under certain conditions. When excluding trades outside the bid/offer spread [Second Filter] is combined with the first filter the number of outliers that are outside the bid/offer spread is approximately 1%.
Table 1 – The number of outliers by broker
| Broker | Number of December Trades | Number of outliers | % outliers | Number of trades outside bid/offer | % outside of bid/offer | Outliers outside bid/offer | % outliers outside bid/offer |
|---|---|---|---|---|---|---|---|
| First Filter | Second Filter | Combined Filters | |||||
| A | 2,232 | 109 | 4.88% | 56 | 2.51% | 1 | 0.04% |
| B | 6,530 | 312 | 4.78% | 2,879 | 44.09% | 124 | 1.90% |
| C | 294 | 6 | 2.04% | 11 | 3.74% | 1 | 0.34% |
| D | 28,623 | 2,220 | 7.76% | 2,621 | 9.16% | 277 | 0.97% |
| Combined | 37,679 | 2,647 | 7.03% | 5,567 | 14.77% | 403 | 1.07% |
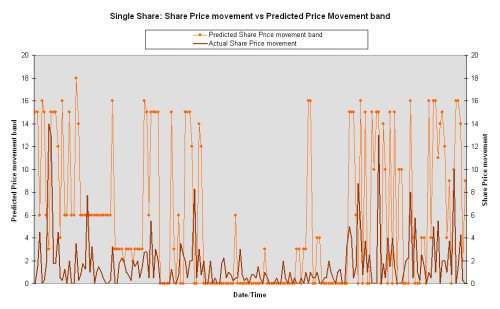
The research team also examined how well the SVM could predict the magnitude of a single share’s price movement. By plotting the actual share price movement since the last trade against the SVM predicted price movement band it is evident that the SVM does achieve reasonable predictions of price movement and ultimately responds well to changes in the market. In the chart below the three outliers for the share are plotted in green. It is interesting to note that in all three cases the SVM presages major changes, but for this broker they hadn’t occurred at that point.
Chart 2
An inspection of the anomalous trades with the participating brokers was undertaken and it was agreed that the system was providing trades worthy of investigation:
“This system highlighted anomalous trades and if we had been using it, we would certainly have investigated any of these trades that were outside the Bid/Offer spread”.
“This system would be a great way of seeing a small number of ‘odd looking’ trades that we could check - the fact that the same principles could be applied to fixed income and other instruments makes it particularly interesting”.
“An extremely interesting and innovative approach – the trades that were highlighted would certainly have been investigated. Whist there was no real pattern or similarity in the outliers they were all things that should have been looked at”.
“I was fascinated to see the selection of trades that this system identified – there were good reasons why all of them traded at the prices shown but they were just the sort of trades that we should have been looking at”.
“The prototype workstation, with all the information about each trade and the drill down functionality is just the sort of tool we would use.”
Moving Towards a Compliance Workstation
PropheZy is a statistical and information technology approach with applications in numerous areas that Z/Yen terms dynamic anomaly and pattern response. Anomaly detection using PropheZy has wide applicability in a number of trading markets beyond equities, for example foreign exchange, fixed income and commodities. In addition, the sifting approach to identify anomalous trades could be expanded from just price to cost, speed, venue, order fulfilment, client instructions and size.
The project was not however, just a statistical exercise. During the course of the project the team provided a prototype “Compliance Workstation”. The Compliance Workstation combined a number of tools (PropheZy, VizZy, FractalIntelligence and Decisionality within an Excel framework) that provided a number of features, specifically the ability to:
- Construct predictive tests on any trade characteristic in order to spot anomalies;
- Spot anomalies using cluster analysis;
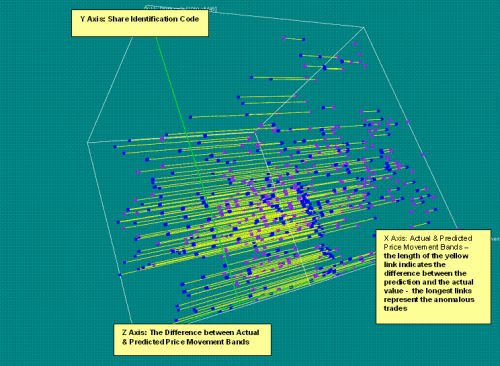
- Display the results visually, specifically showing predicted versus actual differences in three dimensions [Diagram 1];
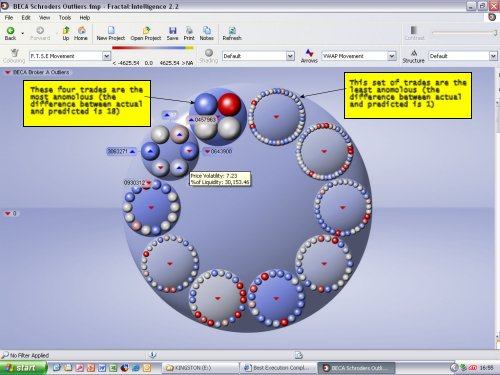
- Provide a ‘drill down’ tool for a compliance officer to relate any of the analyses to specific trades [Diagram 2];
- Track the investigation process, providing an ‘audit trail’ of compliance officers’ work.
Diagram 1: Contrasting a sub-set of actual versus predicted trade price bands
The compliance workstation provides a ‘drill down’ tool for a compliance officer to home in on specific trades by drilling down through a variety of hierarchies. Shown here is a set of trades that fell outside the bid/offer spread and is arranged in 10 circles, showing trades with increasing differences between actual and predicted price movement.
Diagram 2: Drilling down to investigate specific anomalous trades
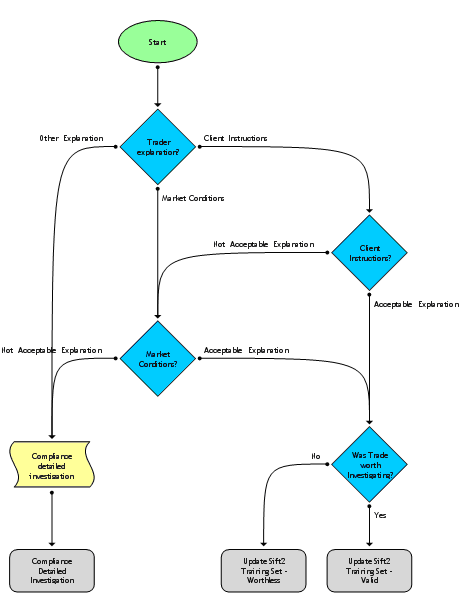
Process: The compliance workstation has a workflow management tool that helps the compliance officer. The first stage of the process is filtering for anomalous trades. These trades are referred to the trader for explanation – do client instructions, market conditions, the size of the trade or any other factors explain the execution price? This system tracks investigations and provides a compliance ‘audit trail’.
Diagram 3: Workflow mapping of the investigation process also provides an audit trail
Next Steps
The BECA project is exciting because it shows that the automated sifting of trades can identify anomalies, thus reducing the costs of complying with MiFID while simultaneously increasing the effectiveness of the compliance function. The Compliance Workstation is available to firms for purchase in order to help comply with MiFID. The BECA project could be extended, with some further testing, to buy-side (asset managers and investment managers) compliance and other markets. The BECA project also provides an opportunity for exchanges who wish to provide a centralised compliance service for their members.
More Information:
- Project Summary (PDF)
- Best Execution Compliance Workstation Flyer
- Michael Mainelli and Mark Yeandle, "The Best Execution: Trader or Client?", Fund AIM, Volume 1, Number 1, pages 43-46, Investor Intelligence Partnership (January 2007).
- Mark Yeandle, "Best Execution Compliance Automation", Financial Services Research (April 2006).
- Michael Mainelli and Mark Yeandle, "Best Execution Compliance Automation, Towards An Equities Compliance Workstation", Journal of Risk Finance, Emerald Group Publishing Limited (June 2006).
- Michael Mainelli and Mark Yeandle, "Best Execution Compliance, New Techniques for Managing Compliance Risk", Journal of Risk Finance, Emerald Group Publishing Limited (June 2006).
- PropheZy
- VizZy
For further information on this project please contact either Michael Mainelli or Mark Yeandle on +44 207-562-9562.