When It Pays To Put A Value On Certainty
By
Professor Michael Mainelli and Rakesh Shah
Published by Facilities Management, Volume 9, Number 11, Butterworths Tolley, pages 24-25.
Background
Property and facilities people are starting to pay more attention to cost per workstation (cost/workstation) than cost per square foot or square meter (cost/m2). Cost/m2 has been a venerable measure because it was an apparently simple number that allowed people to compare costs quickly. As with most shorthand measures, it also had shortcomings. Different organisations had different calculations – usable space versus total; capital expenditure included, amortised or ignored[1]. Perhaps the most important shortcoming was that cost/m2 was not related to “the business”.
For office-based staffing, which ought to be highly comparable within most organisations if not among organisations, cost/workstation has grown in importance. The move from cost/m2 to cost/workstation brings property cost measures closer to “the business”, but both measures are sensitive to their denominator, the definition of m2 in one case and the definition of workstation in the other. Moreover, cost/workstation raises quite clearly the importance of workstation occupancy.
Z/Yen’s Work
Z/Yen works across the property field in a range of risk/reward projects. We frequently help our clients make better business cases for change or help to improve their proposals to management or prospective clients. One such project has been working with a large facilities management firm to help them make a case for a multi-site client that cost-reduction, while important, should not be the key criteria for choosing their facilities management supplier. As our client is not the least-cost provider, it was essential to identify some other value proposition. We suggested that the key selection criteria should be the facilities management firm’s ability to prove it can manage cost volatility at an acceptable quality level, i.e. the facilities management firm provides cost certainty. The facilities management firm needed to put a value on certainty, which led to some of the solutions below.
Cost volatility is measured in a number of ways. The simplest measure is to look at the range of possible cost outcomes, typically as a histogram, and then calculate the standard deviation. Where the standard deviation is high, cost volatility is high. Costs can come from a number of sources, e.g. the firm’s data, data from multi-client surveys or industry benchmarks. For the sake of openness and understanding, this article will illustrate two key concepts, “risk as cost volatility” and “occupancy volatility” with 2001 data from the “Total Office Cost Survey”[2] (TOCS) researched by City University Business School and Actium Consult, sponsored by MWB.
TOCS and Cost Volatility
TOCS data is structured around a “virtual” building of 50,000 square feet net internal area with 357 staff. This building is meant to be a fully-functional, typical office, e.g. meeting rooms, catering facilities, and reception all take up space. The costs of the building are also complete, e.g. reprographics, energy and security are all included. The building is “sited” at different locations around the country and costs are provided for each location by a variety of suppliers. Capital costs are spread appropriately and then apportioned to each workstation.
The TOCS data from 2001 provides an average cost/workstation nationally of £10,025. Our client also had a special interest in the City, where the average cost per workstation was £16,771. Looking at the TOCS data from a “risk” perspective can be complex, but we have tried to simplify it. The diagram below examines the volatility of cost (measured by standard deviation) against the sensitivity of cost (the amount that the cost type influences total occupancy cost). For the purist, the volatility is measured using a weighted average across locations rather than, as we hope to do in future with more time series data, over time at the same location, probably against an index.
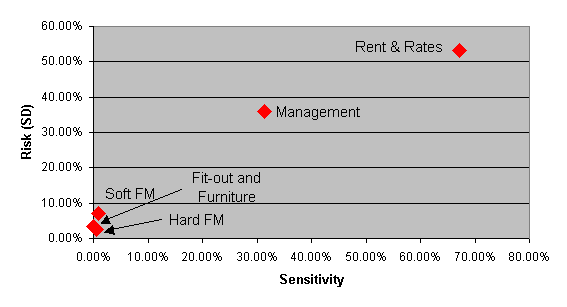
In theory, items in the top right should be strategic cost drivers; those in the bottom right need tight control; and those in the top left require innovative contracting and risk transfer. One of the first things one can observe from the TOCS data is that, according to theory, two headline cost items are strategic cost drivers (rent & rates, management) and three are unimportant cost risks (soft FM, hard FM, fit-out and furniture). Clearly rent & rates are the riskiest and most important determinant of cost/workstation. Once a company has selected a location and negotiated rent & rates, the next most important item is management costs. A total outsourcing solution has a lot to offer in controlling management cost risk. More detailed analysis of TOCS has shown that more detailed, line-by-line cost items do not exhibit much volatility. However, most people forget that the TOCS data is based on 100% occupancy.
Occupancy Volatility
In practice of course, no building is fully occupied all of the time. From time to time, some buildings are overcrowded, but the majority of buildings have some spare space. It is difficult to operate a building effectively without spare space. While the amount of spare space varies tremendously, working with the TOCS team and based on our experience, we thought we would re-examine the numbers using an occupancy rate of 85% rather than 100%. Some readers might argue for a slightly higher occupancy rate, but the principles of the following argument are the same and, looking at real cases, occupancy is frequently much less than people believe.
Firstly, the cost/workstation goes up noticeably as each workstation bears the empty space costs, so nationally from £10,025 to £11,794 and in the City from £16,771 to £19,731. This 17.6% increase is important. As this is the real cost/workstation for a longer-term lessee or owner, the managed office service companies are a competitive alternative, assuming that other strategic issues are ignored.
However, this is not the entire argument. The 17.6% increase is based on no volatility. If volatility were 0%, then the building should be filled up. In reality, a building will go up to 100% occupancy (and perhaps a bit more) from time to time, as well as slipping below the average 85% occupancy on occasions. The volatility is very important. Cost/workstation goes up or down as the building empties or fills. The amount of volatility can be estimated from the occupier’s workstation demand and employment. The following chart is based on a model that calculates the cost/workstation under different volatilities. The model increases cost/workstation when occupancy drops below 85%, decreases cost/workstation when occupancy rises up to 100%, and increases cost/workstation when occupancy rises above 100% (i.e. assume new accommodation can be found at short notice, but at the 85% occupancy rate).
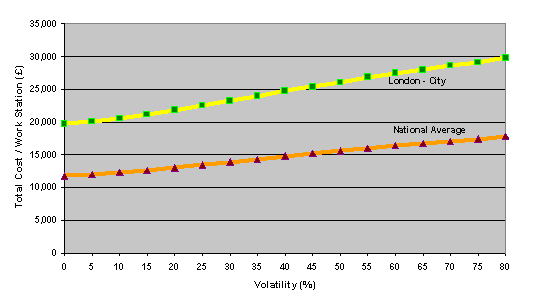
The above chart shows that occupancy volatility is a significant contributor to a “true” cost/workstation. Property managers should work to determine the actual risk by looking at employment numbers and variations. In our experience, staffing volatility of 25% is quite common, just look at the down-sizing and right-sizing numbers as they affect some organisations, or look at the rate of staff increases during booms. The impact of 25% volatility is that space wastage or overflow increases the cost/workstation by £1,695 nationally and by £2,836 in the City.
Selling Certainty
“Measure what is important; don’t make important what you can measure.”
Robert S McNamara (US Secretary of State for Defence during the Vietnam War) to his air force chiefs on his discovery that they were using the number of buildings destroyed by bombs as a critical success factor.
Facilities management suppliers are trying to convince clients that they can be creative, for instance, cost risks can be mitigated by using a “serviced office” model, which basically guarantees a fixed cost/workstation, assuming the facilities management supplier’s balance sheet and cost management are credible. Yet facilities management suppliers frequently assert the benefits, rather than proposing measures.
In some cases, Z/Yen has analysed the premium costs of serviced offices as a “put option” to sell the remaining costs (typically at virtually nil cost) or a “call option” to purchase temporary space at short notice, although market liquidity is clearly an important factor. If costs are known to be fixed and occupancy is 100%, then these options have little value. If costs can vary and occupancy can vary, then the option increases in value.
The value of these “risk/reward options” can be priced using standard financial tools and show that, although a more-certain-cost solution may cost more, the certainty that it won’t go over a certain amount has great value. Perhaps managed office service providers and facilities managers should be providing clients with tools to help them price risks – occupancy, cost, etc. – in order to prove the value more-certain solutions provide to clients.
Combining “risk/reward option” pricing with some of the risk and volatility arguments above permits our clients to “sell” their solutions to finance directors. These solutions must address the actual business risks of the finance directors, which will not just be occupancy and cost, but also revenue loss (not having the staff to execute business) or business interruption. Identifying and quantifying these business risks can be complicated, but we are finding that facilities managers can use these arguments to their advantage in convincing clients that they are not buying words about cost reduction, rather clients are buying the value of cost certainty.
References
[1] Although do see the OPD International Total Occupancy Cost Code, http://www.opd.co.uk/, for help with getting things right.
[2] www.mwbex.com/toc_pages/toc_home.html
Michael Mainelli is a Director of Z/Yen, with a tremendous amount of property sector experience from both a client and a supplier perspective, including a few years as director of a major property outsourcing company. Michael is non-executive Chairman of a Design-Manage-Construct firm, CityAxis and co-chairman of the DBF working party on risk management.
Rakesh Shah is a Consultant at Z/Yen with a BSc. in Business Studies and a Masters in Actuarial Science from City University Business School. Rakesh’s work at Z/Yen involves quantitative, statistical and stochastic analysis of medium/large datasets, database development and design, and development of financial models.
Z/Yen Limited is a risk/reward management firm working to improve business performance through better decisions. Z/Yen undertakes strategy, systems, intelligence, marketing and organisational projects in a wide variety of fields (www.zyen.com). Z/Yen works in the property sector helping clients make outsourcing decisions or sell outsourcing solutions, as well as conducting market research and developing procurement strategies.
[A version of this article first appeared as “When it Pays to Put a Value on Certainty”, Facilities Management, Volume 9, Number 11, Butterworths Tolley (August 2002)pages 24-25.]