Rubies In The Dust
By
Ian Harris and Mary O'Callaghan
Published by Charity Finance, (December 2012), pages 44-46.
Ian Harris and Mary O'Callaghan,The Z/Yen Group
[An edited version of this article appeared as "Rubies In The Dust" Charityfinance, (December 2012), pages 44-46.]
Ian Harris and Mary O’Callaghan explain in lay terms the maths and tools used for predictive analytics, outline examples of use in the civil society sector and provide a practical case study on boosting returns from donor database fundraising.
Analyze This
“Predicting is very difficult, especially about the future.” We’re pretty sure that the Danish physicist Niels Bohr came up with that much-used quotable, but it is often attributed to a variety of other people, ranging from Confucius to Sam Goldwyn via George Bernard Shaw. This possibly proves that both prediction and attribution are very difficult. Charity finance people often need to predict future results and also to attribute results to the activities that caused them. There are plenty of techniques available to help predict and attribute; portfolio theory, Monte Carlo simulation and linear programming are good examples. We tend to use these techniques in charities on problems such as cost/benefit optimisation of charitable activity, rebalancing a charity’s investment portfolio, or setting reserve level ranges.
In recent years we have been using statistical learning models, known as support vector machines (SVMs), to predict and classify individual items of information. In simple terms, SVMs are learning algorithms, especially suited when you need to model data in order to classify items and predict outcomes. It is a sophisticated form of regression analysis, the key point being the remarkable accuracy of its results. Outside the civil society sector, uses include predicting television viewing figures from programme and transmission data and detecting individual anomalous transactions in financial services data. Within the civil society sector, we have been using SVMs to predict the effectiveness of specific grant applications, to boost the effectiveness of fundraising campaigns by finding individuals who are surprisingly likely to give and to retain/reclaim members who would otherwise leave. Our company, Z/Yen, has its own SVM, PropheZy. Z/Yen’s SVM is not the only show in town, although a recent survey of the charity sector failed to uncover anyone else making significant use of SVMs in the civil society sector…yet.
You don’t need to be a massive civil society organisation to benefit from these techniques; we have used one or more of the above with various charities, including The Marine Stewardship Council, Action for Blind People, City Parochial Foundation, The New Opportunities Fund (now The Big Lottery), Royal National Institute of Blind People, plus other civil society organisations such as trades unions, professional bodies and religious organisations.
Predict That
We predict that charities increasingly will be deploying these types of analytical techniques. Even at the best of times, charities need to make the most of their donor and membership lists; in today’s difficult climate, that need is even more urgent. Also, as more charities use analytical techniques to understand their donors and members better, weaker charities will be left behind. In particular, we predict that charities will increasingly “get down and dirty” with their data, using modern techniques such as SVMs to classify and predict down to individuals. On direct fundraising, such as direct mail from warm lists, we describe the analysis as “rubies in the dust”, i.e. finding good donors amongst those people who have given in the past but appear to have lost interest in us.
Case Study One: Rubies In The Dust
A national charity with annual voluntary income of close to £12 million per annum worked with us to see if our SVM, PropheZy, could improve its direct mail fundraising performance by finding rubies in the dust of its donor database. This charity was very good at direct mail fundraising compared with most large charities, especially in high volume, low value campaigns. However, the fundraisers felt that they could achieve more from their database of c400,000 donors and were intrigued to match their “rule of thumb” skills against the SVM.
Our first step was to model historic data, to see whether we could “predict” donors from data on campaigns that had already run. Such a step is always needed when using an SVM, as the technique requires a data set, known as a “training set”, to generate the algorithms that will be used on the actual data to be analysed – the “trial sets”.
It was quickly clear that the data was suitably predictive, but we also used this stage of the experiment to enhance PropheZy’s performance. In this case by:
- varying the amount of donor history assessed by PropheZy;
- boosting the proportion of givers in the initial training set;
- banding donors at differing levels of probability of giving.
At this point it is worth pointing out a couple of unusual, useful characteristics of SVMs. Firstly, SVMs can cope with gaps in the data, as long as the “gappy variable” has a reasonable amount of data in it. Secondly, SVMs will ignore a variable completely if the data within it is too sparse or not predictive. Note that we are saying “ignore” here, so the predictive quality doesn’t deteriorate with poor data, the SVM simply predicts as well as it can from the data it has. In this case, the age field was very sparsely populated, to such an extent that it had no predictive quality. The sex field had gaps in it but could still help the predictive performance. We also learned that increasing amounts of donor history improved predictive performance, until you tried to include more than five previous asks for each donor. The data from six or seven asks ago had no effect on the results at all. The only other highly predictive field was the gift aid indicator.
The following diagram illustrates some of the variables and can provide some clues to the predictive drivers. The X axis shows demographic code (an indicator of wealth), the Y axis shows number of years on the database and the Z axis shows the PropheZy prediction – “will give” in the foreground, “won’t give” in the background. Blue dots show the actual result for an individual; if there is no yellow line attached that indicates that PropheZy correctly forecast the result. Red dots with yellow stalks show the PropheZy prediction when it is at variance with the actual results.
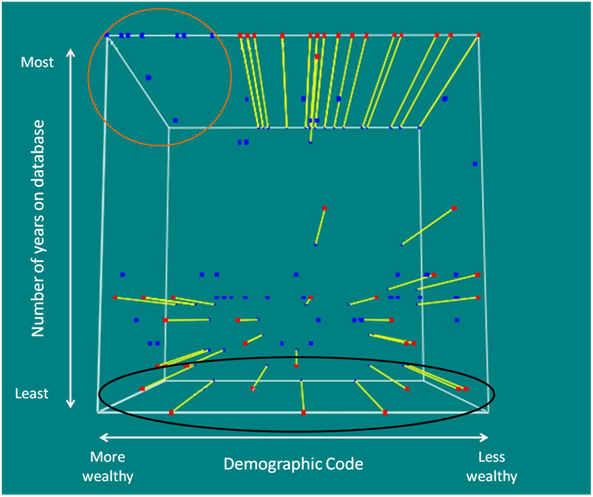
People in wealthier demographic postcodes, who had been on the database for a number of years tended to be correctly identifiable as likely to give, even if they hadn’t given for some time – see the blue dots in the area ringed in orange, whereas people who had not been on the database for long were much harder to identify as potential donors – see the red dots with yellow stalks in the area ringed in black.
Having tuned the model on a number of trials using historic data, we were ready to conduct a trial on a substantial live mailing. The charity identified the donors it would normally mail for that campaign, while Z/Yen ran the whole dataset against PropheZy to look for rubies in the dust. PropheZy identified 16,000 donors as highly likely to give, around 14,000 would have been included in the charity’s regular mail shot anyway. But 2,000 of them would not have been chosen, as they seemed to be poor prospects using the charity’s regular methods.
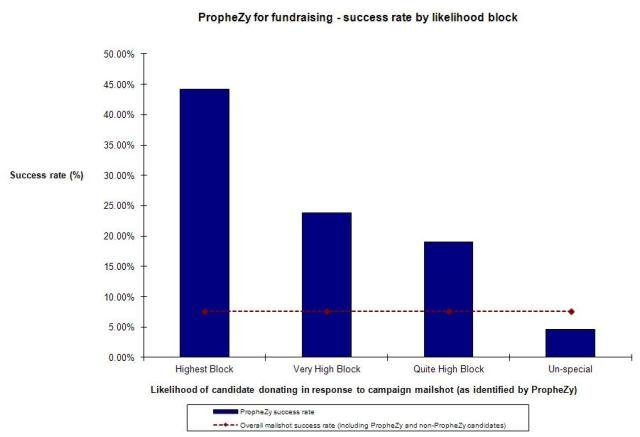
The table and graph below illustrate the SVM predictions and the results divided into four blocks, the top three of which represent varying levels of predicted high likelihood to give, the final block representing the less-promising prospects.
| Likelihood block | Potential donors identified by PropheZy | Actual donors in response to campaign mailshot | PropheZy success rate (%) |
|---|---|---|---|
| Highest Block | 3,722 | 1,645 | 44.20% |
| Very High Block | 5,837 | 1,393 | 23.86% |
| Quite High Block | 6,520 | 1,239 | 19.00% |
| Un-special | 103,566 | 4,828 | 4.66% |
| MAILSHOT TOTAL | 119,645 | 119,645 | 7.61% |
The successful response rate amongst the “rubies in the dust” within those three promising blocks was 29.6%; which meant around 600 additional donors. This represented roughly 15% increase in number of donors and a revenue boost of just over 10% for the campaign.
We consider this result to be very significant; the predictive ability of the SVM over and above conventional techniques is extremely promising from this trial. But financially, the results on a warm direct mail campaign of this sort are good but not spectacular. However, applying the same technique on higher-value items, for example identifying donors who have a propensity to graduate to regular giving or legacy pledges, could be very valuable indeed. No charity can afford to ignore such opportunities to increase the returns from its supporter base and to boost voluntary income.
Ian Harris leads Z/Yen’s Civil Society sector practice. Ian’s work includes reviews and strategies with Marine Stewardship Council, UNISON, Institute of Fundraising, PDSA, Charityshare, Institute of Chartered Accountants in England and Wales, Barnardo's, National Trust, Rethink, The British Heart Foundation, The Shaftesbury Society, Cancer Research UK, NSPCC, British Red Cross Society, Action For Blind People, BEN, The Children’s Society, Macmillan Cancer Relief, Charity Logistics, WWF, Women’s Royal Voluntary Service, the General Social Care Council and PEFC. Ian regularly leads award-winning work, such as Charityshare’s partnership award, Ideal Hardware’s HR Award for its rewards framework and the Marine Stewardship Council’s Best Practice award for its strategic planning and governance review. Ian chairs the judging panel for the National Payroll Giving Excellence Awards and chairs BCS The Institute for IT’s Ethics Group. He is co-author, together with Michael Mainelli, of the practical book "IT for the Not-for-Profit Sector", the best-selling novel "Clean Business Cuisine" and their award-winning latest book “The Price of Fish: A New Approach To Wicked Economic and Better Decisions”.
Mary O’Callaghan is an experienced project and programme manager who has worked with many civil society organisations on IS and systems strategies and reviews, including, Action for Blind People, NSPCC, The Shaftesbury Society, British Film Institute, British Red Cross, British Heart Foundation, Cancer Research UK, National Trust, Plan International, General Social Care Council (GSCC) and UNISON. Mary also manages the CCitDG benchmark for Z/Yen and has led Z/Yen’s research into Evidence of Worth for the Not for Profit Sector. She is a graduate of Trinity College Dublin and NUI Galway and is a certified Prince 2 Practitioner.