How I Learned To Start Worrying & Love The Dot.Bomb
By
Professor Michael Mainelli, Ian Harris
Published by Strategy, The Strategic Planning Society, pages 6-7.
Imagine that you face the following pair of concurrent decisions. First examine both decisions, then indicate the options you prefer:
Decision A
You can cash in on your dot.com shares. In any case, you will have to wait two weeks, but you have a choice to make today as to whether you:
(1) agree a sale price today for a sure gain of £2,400;
(2) wait for a sale price for two weeks with a 25% chance to gain £10,000, and a 75% chance to gain nothing.
Decision B
Choose between two ways out of a loss-making dot.com company:
(3) one way you have a sure loss of £7,400;
(4) the other way a 75% chance to lose £10,000, and a 25% chance to lose nothing.
While you ponder your answers (given after the next few paragraphs), these choices have been designed to illustrate “Prospect Theory”. Prospect Theory attempts to describe why individuals make decisions which deviate from rational decision-making. Rational decision-making is a model which assumes decision-makers define the problem; identify and weigh criteria according to their preferences; know and assess all relevant alternatives; and accurately calculate and choose the alternative with the highest perceived value. Economists, and other social scientists with an interest in decision-making, have found that the difference between the rational model (how decisions ought to be made) and the real world (what decisions are made) is so significant that their rational models can be of little use. Increasingly, economists are trying to take into account empirical work on decision-making in the real world. Prospect Theory attempts to explain why some types of real world decisions deviate consistently from rational decisions. According to The Economist (18 December 1999):
“The psychological idea that has so far had the greatest impact on economics is ‘prospect theory’. This was developed by Daniel Kahneman of Princeton University and the late Amos Tversky of Stanford University. It brings together several aspects of psychological research and differs in crucial respects from expected-utility theory—although, equally crucially, it shares its advantage of being able to be modelled mathematically. It is based on the results of hundreds of experiments in which people have been asked to choose between pairs of gambles.”
Prospect Theory was first put forward by Kahneman and Tversky in 1979, Prospect Theory: An Analysis of Decision Under Risk (Econometrica 47, 263-291). In short, Prospect Theory recognises that people treat risks concerning perceived losses differently from risks concerning perceived gains. Further, people’s treatments of risk follow common and systematic deviations from the rational model. Prospect Theory proposes that:
- people evaluate rewards and losses relative to a neutral reference point;
- people adopt risk-averse behaviour concerning gains (i.e. they will value initial gains more than subsequent gains);
- people adopt risk-seeking behaviour over losses (i.e. they will forego higher degrees of certainty over loss to seek choices which reduce the loss more markedly);
- people’s response to loss is greater than their response to gain (i.e. the pain associated with losing £100 is greater than the pleasure of winning £100);
- people tend to give too much emphasis to low probability events (i.e. they overweight low probability events while underweighting medium and high probability events).
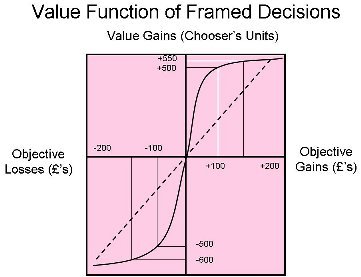
Prospect Theory is frequently summarised in a diagram similar to the one here. In this diagram, the X axis represents the units gained (to the right) or lost (to the left) in objective, rational terms (i.e. the genuine probability of winning or losing money). The Y axis represents the units of utility associated with varying levels of gain (above the line) or loss (below the line). Over 20 years of research has indicated that the S-curve best represents the function associated with most human choices. As you can see, the top right quadrant shows that people would rather take a sure gain while the bottom left quadrant shows that people would rather gamble to avoid a loss. Increasing the objective gain or loss by 33% (i.e. £50, from +/- £100 to +/- £150) in the diagram only increases the value gain by 10% or the value loss by 20%
Let’s look at what Prospect Theory might indicate about the dot.com bubble. The key to continuing with this discussion is an assumption that valuations of dot.com companies are in excess of their ‘objective’ value (a widely-held assumption in aggregate, but one that would justify discussion over several articles). If we assume dot.com valuations are excessive, then investors are risk-seeking, i.e. we should place their decisions in the lower left quadrant. Prospect Theory implies that investors are deliberately seeking risk because they believe that from their neutral decision making point, they are already losing.
Prospect Theory emphasises the importance of framing the problem. The way in which a problem is presented, i.e. as starting from a position of gain or from a position of loss, is crucial to the position of the neutral reference point. The difference between Prospect Theory and economic theories of diminishing marginal utility is that marginal utility assumes that people only consider their choices in terms of the final outcome, not from where they start. At first glance, framing seems either hard or non-sensical, however framing is everything, such that in some problems 250 lives saved is more than ¼ as valuable as 1,000. Many insurance offers rely on Prospect Theory. Consider being given £1,000 then asked for a preference between £500 more for certain versus a 2/3 chance of £1,000 more or 1/3 chance of nothing – the £167 objective difference between the decisions is often expressed by the offeror as a form of insurance.
If you want to drive decision-makers towards a riskier decision, convince them that they are already losing. If you want to drive decision-makers towards a risk-averse decision, convince them that they are ahead and stand to lose quite a bit. “You have to speculate to accumulate” drives decision-makers towards riskier choices, whilst “let’s not throw good money after bad” drives them away from risk-seeking choices. Both phrases take advantage of framing to move decision-makers’ perspectives. To speculate implies they are already behind. To throw good money implies they are in a position where they stand to lose more.
So, back to the opening problem. For most people the choice for Decision A is (1) and the choice for Decision B is (4). Mathematically the clear objective ‘right’ answers are (2) and (3). Decision A’s objective expected outcomes are (1) £2,400 or (2) £2,500, yet people prefer (1). Decision B’s objective expected outcomes are (3) -£7,400 or (4) -£7,500, yet people prefer (4). In similar tests, the percentage preference for (1) or (4) is in the high 80’s and the percentage of people who prefer both is in the 70’s.
Is the dot.com mania born of panic at losses, not at excitement from potential gains? Clearly, for some of the large institutional funds, competitively measured each year against their peers, failing to have made significant dot.com gains already means that they are losing and will want to seek more risk. For individual investors this explanation is a bit less likely. The rising market may make them feel that they are already winners and thus, according to Prospect Theory, they should become risk averse, getting out of or staying away from dot.com’s. On the other hand, individual investors may be looking at their peers who have made large gains (at least on paper). If individual investors feel that they are losing out against their peers, they may become more risk-seeking.
Further, investors may have several different tranches of investment. There might be a base level of investment which they do not wish to put at significant risk, e.g. pension, but there may also be a tranche of investment, their ‘gingerbread’ layer, where they are prepared to take large risks for large gains. The only difficulty with using the gingerbread layer to explain high dot.com valuations is that it appears to have risen in volume many-fold in a short space of time. A lot of people suddenly have more gingerbread and a greater desire to seek risk with their gingerbread investment tranche. There are numerous additional explanations, e.g. the need for increased portfolio diversification for a new portfolio area or the increased vulnerability of old economy shares leading to re-weightings.
On the other hand, investors may have converted en masse to Mark Twain’s contrarian, anti-portfolio investment strategy (from Pudd’nhead Wilson):
“Behold, the fool saith, ‘Put not all thine eggs in the one basket’ – which is but a manner of saying, ‘Scatter your money and your attention’, but the wise man saith, ‘Put all your eggs in the one basket and – watch that basket.’”
If it is herd behaviour that is driving us towards dot.com’s, perhaps it is the behaviour of a herd in panic, not euphoria. And the surest way to help the herd avoid the dot.bomb? According to Prospect Theory, “as you have already gained so much, now look at what you stand to lose!”
Further reading:
Max Bazerman, Judgment in Managerial Decision Making (Fourth Edition), John Wiley & Sons, 1998.
Robyn M. Dawes, Rational Choice in an Uncertain World, Harcourt Brace Jovanovich, 1988.
Charles P. Kindleberger, Manias, Panics and Crashes, John Wiley & Sons, 1978.
Michael Mainelli and Ian Harris are both Directors of Z/Yen Limited. Z/Yen is a risk/reward management firm which uses risk analysis and reward enhancement techniques to improve organisational performance. Z/Yen advises organisations on strategic planning and decision-making.
[An edited version of this article first appeared as "How I Learned to Start Worrying & Love the dot.bomb", Strategy, The Strategic Planning Society (May 2000), pages 6-7. We'd like to note that it was submitted to Strategy in December 1999.]