Environmental Consistency Confidence: Scientific Method In Financial Risk Management
By
Professor Michael Mainelli
Published by Risk Management In Finance: Six Sigma And Other Next-Generation Techniques, Chapter 22, Anthony Tarantino & Deborah Cernauskas (eds), John Wiley & Sons (2009), pages 273-288.
Abstract
The application of the scientific paradigm to business operations transformed management thinking in the early part of the 20th century. A plethora of management theorizing since often obscures the simplicity at the core of the scientific paradigm. One approach, Environmental Consistency Confidence, restores statistical correlation to its rightful place at the core of financial risk management. For financial services organisations statistical correlation integrates well with existing Key Risk Indicator (KRI) initiatives. Through Environmental Consistency Confidence, financial organisations understand the limits of their environmental comprehension.
Introduction
In late 19th century, Frederick Winslow Taylor promoted scientific management. The legacy of Taylor’s early attempts to systematise management and processes through rigorous observation and experimentation led to the quality control movement from the 1920’s, Operations Research and Cybernetics from the 1940’s and Total Quality Management from the 1980’s leading through to today’s Six Sigma and Lean Manufacturing. The aim of scientific management is to produce knowledge that improves organisations using the scientific method. Taylor promoted scientific management for all work, such as the management of universities or government.
The scientific method is based on the assumption that reasoning about experiences creates knowledge. Aristotle set out a threefold scheme of abductive, deductive, and inductive reasoning. Inductive reasoning generalises from a limited set of observations – from the particular to the general – "every swan we’ve seen so far is white, so all swans must be white". Deductive reasoning moves from a set of propositions to a conclusion – from the general to the particular – "all swans are white; this bird is a swan; this bird is white". But neither inductive nor deductive reasoning is creative. Abductive reasoning is creative, generating a set of hypotheses and choosing the one that, if true, best explains the observations – "if a bird is white perhaps it’s related to other white birds we’ve previously called ‘swans’, or perhaps it’s been painted white by the nearby paint factory" - from observations to theories. Abductive reasoning prefers one theory based on some criteria, often parsimony in explanation, such as Occam’s razor, "all other things being equal, the simplest explanation is the best".
The scientific method is the application of a process to the creation of knowledge from experience. The hypothetico-deductive model is perhaps the most common description of the scientific method, algorithmically expressed as:
- "Gather data (observations about something that is unknown, unexplained, or new);
- Hypothesize an explanation for those observations;
- Deduce a consequence of that explanation (a prediction);
- Formulate an experiment to see if the predicted consequence is observed;
- Wait for corroboration. If there is corroboration, go to step 3. If not, the hypothesis is falsified. Go to step 2."
[Source: http://en.wikipedia.org/wiki/Hypothetico-deductive_model]
The scientific method is hardly a sausage-machine. William Whewell noted in the 19th century that that "invention, sagacity, genius" are required at every step in scientific method. Perhaps the most interesting 20th century insight into the scientific method came from Karl Popper, who asserted that a hypothesis, proposition, or theory is scientific only if it is falsifiable. Popper’s assertion challenges the idea of eternal truths because only by providing a means for its own falsification can a scientific theory be considered a valid theory. Every scientific theory must provide the means of its own destruction and thus is temporary or transient, never an immutable law.
Most managers would consider at least a part of their management style to be ‘scientific’. They deal with numbers. They use numbers to spot anomalies, examine them for further evidence and make decisions based, at least partly, on numerical reasoning processes. MBAs graduate having studied ‘quant’ skills. Accountants deploy their arithmetical techniques across businesses. It is true that Aristotle’s inductive reasoning process, "every Christmas our sales go up, thus our sales will go up this Christmas", and abductive reasoning process, "our sales go up at Christmas because people like to give presents, or because people buy our fuel oil", are widely used. However, the deductive formality of the scientific process in management is rarely applied.
- Gather data (observations about something that is unknown, unexplained, or new) – "we’ve detected an unusual decrease in trade closure times";
- Hypothesize an explanation for those observations – "using our abductive methods we can surmise that ‘clients have changed their purchasing behaviour’ or ‘our new computer system has sped things up’ or ‘our traders are up to something’;
- Deduce a consequence of that explanation (a prediction) – "we should see ‘a change in phone call lengths’ or ‘contrasted times between manual and computer trades should be larger’ or ‘the nature of trades have changed’;
- Formulate an experiment to see if the predicted consequence is observed – don’t accept an easy explanation, go and check;
- Wait for corroboration. If there is corroboration, go to step 3. If not, the hypothesis is falsified. Go to step 2.
Paradigms Applied – Values, Control, Re-Engineering And Costing
When it comes to risk management, the core process should be one of scientific management. Wholesale financial institutions frequently lack financial risk management structured for its own sake, rather than as a response to regulatory pressures. Wholesale financial institutions tend to respond positively to regulatory initiatives, but otherwise do what everyone else is doing. Wholesale financial institutions have deployed at least four generic approaches for managing and modelling operational risk, with limited success – shared values, control structures, re-engineering and costing risk.
Let’s start with "shared values" approaches. While not denying the importance of culture [Howitt, Mainelli & Taylor, 2004] – "would one rather have a bunch of honest people in a loose system or a bunch of crooks in a tight system?" – and its crucial role as the starting point for risk management, cultural change is hard to formalise. At one extreme, one can parody culturally-based risk programmes as "rah! rah!" cheerleading – "every day in every way let’s reduce risk", but people in organisations do need to share values on risk awareness, assessment and action. Shared values are essential, but insufficient for financial risk management.
Another common approach is "control structures". Often denigrated as "tick-bashing", control structure approaches are particularly common in regulated industries. The difficulties with control structures are legion, e.g. tough to design, often full of contradictions (‘Catch-22’s’), difficult to roll-back, expensive to change. Control structures often result in a command-and-control organisation, rather than a commercial one, with costs frequently exceeding not just the potential benefits but also the available time [Mainelli, 2003]. Some institutions deploy risk dashboards or ‘radars’ – tools that aggregate procedural compliance - with little consideration of the human systems within which this approach is being applied. While this heuristic approach is culturally suited to banks (bureaucratic ‘tick-bashing’ and form-filling with which they are familiar), excessive control structures undermine and contradict shared values.
The positive view of undermining is "working the system", but the negative view is lying. A simple example, managers inculcate a lying culture among subordinates to avoid chain-of-command pressures on targets – "I know you can’t lock the computer door on our African computer centre because you’ve been awaiting air conditioner repair for the past five days, but could you just tick the box so my boss stops asking about it on his summary risk report?". Another example, people repeatedly answer questions with the desired answer, e.g. "does this deal have any legal issues" – strongly-suggested-answer-for-an-easy-life "no", thus penalising honest thinking. Finally, the resulting RAG (red-amber-green) reports cannot be readily summarised or contrasted - five open computer room door incidents may be rated more important than a single total power outage;
"Re-engineering" via process modelling and redesign is used in many industries, including finance. Many financial institutions document their operations in order to analyse their operational risks. Many of the tools used to document operations are the same tools used by system dynamics simulation models. This happy coincidence led many institutions to experiment with system dynamics techniques, but then they encountered problems of validating the models and chaos theory effects, i.e. extreme sensitivity to initial conditions, as well as the expense of trying to maintain models of business operations in a fast-changing environment. Re-engineering is a good tool for improving processes, but does not sit at the heart of risk management.
A risk management approach does integrate with financial and economic theory when "costing risk", typically using economic cost of capital and VAR – "value-at-risk". The basic idea is to build a large, stochastic model of risks and use Monte Carlo simulations to calculate a "value-at-risk" that allows a financial institution to set aside an appropriate amount of capital – "economic cost of capital" – per division or product line. This approach requires probability distributions of operational risk, market movements and credit defaults. Yes, it is difficult and at an early stage, but this approach has merit both for management and regulators. However, it does not provide a core scientific management process.
Environmental Consistency Confidence - Statistical Head, Cultural Heart
What distinguishes good financial risk management from bad? In a nutshell, it’s a scientific approach to risk. At the core of the scientific approach is a statistical engine room of some form:
"Statistical and applied probabilistic knowledge is the core of knowledge; statistics is what tells you if something is true, false, or merely anecdotal; it is the ‘logic of science’; it is the instrument of risk-taking; it is the applied tools of epistemology."
[Taleb, 2008]
Environmental Consistency Confidence is an approach to risk management that says, "if you can predict incidents and losses with some degree of confidence, then you have some ability to manage your risks". You are confident to some degree that outcomes are consistent with your environment and your activities. The converse, "if you can’t predict your incidents and losses", implies either that things are completely random – thus there is no need for management – or that you’re collecting the wrong data. Knowing that incidents and losses are predictable then leads to application of the scientific paradigm. From a proven hypothesis, financial risk tools such as culture change, controls, process re-engineering or risk costing can be usefully applied.
A few years ago, when promoting Environmental Consistency Confidence to one trading firm, Z/Yen posed a tough question, "why can’t you predict the losses and incidents flowing from today’s trading?". The idea was to look at the environmental and activity statistics for each day and use multi-variate statistics to see how strong the correlation was with incidents and losses flowing from that day. It is often said that "correlation doesn’t demonstrate causation". That is true, but "correlation should cause questions".
"For example, you might be wondering why people make mistakes when they enter data into a particular system. Some people make more mistakes than others. Are they careless? Do they need training? Is the system hard to use? Do people have too much work to do? Do they make more errors when they work on into the evening? Is there something about the particular data they enter that makes errors more likely? Do changes to the entry screen increase or decrease errors?"
[Matthew Leitch, email correspondence, 2006]
The core of Environmental Consistency Confidence is using modern statistical models to manage financial institutions through the examination of correlations between activity and outcomes. Environmental Consistency Confidence starts with the idea that the organisation is a large black box. If the outputs of the box can be predicted from the inputs using multi-variate statistics, then the scientific management process can be deployed, abductively (creatively), inductively (experience) and deductively (analytically). The key elements of Environmental Consistency Confidence are:
- a strong database of day-to-day environmental factors and trading activities;
- a database of incidents and losses (or errors or non-conformities or other measures of poor performance);
- a unit tasked with predicting future incidents and losses from current factors and activities;
- a "confidence" measure (typically R2) from the unit is about predictive accuracy.
If the unit is highly confident of predictions, then management has work to do, typically deploying scientific management techniques. If the unit is unsure, less confident, then more and better data or predictive techniques need to be sought. Overall, when inputs from the environment and the activity levels match overall outputs, then the organisation is ‘consistent’ with its environment. The idea is not just to amass facts, but to turn anomalies and prediction variances into science:
"Science is facts. Just as houses are made of stones, so is science made of facts. But a pile of stones is not a house and a collection of facts is not necessarily science".
[Jules Henri Poincaré, La Valeur De La Science (1904), from Value of Science, translated by G.B. Halsted, Dover (1958)]
What Is A Key Risk Indicator (KRI)?
Frequently, predicting losses and incidents revolves around correlations with key risk indicators (KRIs). A working definition for KRIs is "regular measurement data that indicates the risk profile of particular activities". KRIs help to form an input for economic capital calculations by producing estimates of future operational risk losses and thus helping to set a base level of capital for operational risk. KRIs can be environmental, operational or financial. KRIs are increasingly important to regulators.
"Key Risk Indicators: risk indicators are statistics and/or metrics, often financial, which can provide insight into a bank’s risk position. These indicators should be reviewed on a periodic basis (often monthly or quarterly) to alert banks to changes that may be indicative of risk concerns."
[Basel Committee on Banking Supervision, "Sound Practices for the Management and Supervision of Operational Risk", Bank For International Settlements (December 2001)]
For wholesale financial institutions, Environmental Consistency Confidence is strongly linked with Predictive Key Risk Indicators for Losses and Incidents (PKRI-LI). The important point to note is that people can suggest many possible risk indictors (RIs), but they are not Key Risk Indicators (KRIs) unless they are shown to have predictive capability for estimating losses and incidents. A KRI must contribute to the predictability of losses and incidents in order to be validated as a KRI. If a RI does not predict losses or incidents, it remains an interesting hypothesis, someone’s unvalidated opinion. The scientific approach to managing risk using statistics also involves trying to discover what the indicators should have been. In other words, what drives operational risk? We describe this approach as predictive key risk indicators to/from loss/incidents prediction (PKRI-LI).
Experience does help to identify the true drivers of operational risk and should help focus attention and control actions, but the PKRI-LI approach supports and validates (or invalidates) expert judgement of true drivers of operational risk losses. The intention of this approach is not to replace expert judgement, but to support that judgement in a more scientific way in an ever-changing environment. For instance, environmental indicators (that might turn out to be KRIs) could be such things as trading volumes and volatilities on major commodities or foreign exchange markets. Operational indictors (that might be KRIs) could be general activity levels in the business, numbers of deals, mix of deals, failed trades, number of amendments, reporting speed, staff turnover, overtime or IT downtime. Financial indicators (that might be KRIs) could be things such as deal volatility, dealing profit, activity-based costing variances or value of amendments.
In a sense the choice is between what is currently done informally (no significant business lacks RIs) and what could be done better through more formality, statistics and science to make them KRIs. For each KRI, there needs to be definition and specification. The table below sets out the characteristics of a KRI as seen by the Risk Management Association:
| Effectiveness | Comparability | Ease of Use |
|---|---|---|
| Indicators should... | Indicators should... | Indicators should... |
|
1. Apply to at least one risk point, one specific risk category, and one business function. 2. Be measurable at specific points in time. 3. Reflect objective measurement rather than subjective judgment 4. Track at least one aspect of the loss profile or event history, such as frequency, average severity, cumulative loss, or near-miss rates. 5. Provide useful management information. |
1. Be quantified as an amount, a percentage, or a ratio. 2. Be reasonably precise and define quantity. 3. Have values that are comparable over time. 4. Be comparable internally across businesses. 5. Be reported with primary values and be meaningful without interpretation to some more subjective measure. 6. Be auditable. 7. Be identified as comparable across organisations (if in fact they are.) |
1. Be available reliably on a timely basis. 2. Be cost effective to collect. 3. Be readily understood and communicated. |
Case Study - Global Commodities Firm
A large global commodities firm active not only in a number of commodity markets but also foreign exchange and fixed income piloted the PKRI-LI approach in one large trading unit. Overall, as might be expected, the findings were that low volume and low complexity days in a low or high stress environment were fine. Intriguingly, low volume and low complexity were slightly worse in a low stress environment. High volume and high complexity days in either a low or high stress environment indicated relatively high forthcoming losses and incidents. High volume and low complexity days caused relatively few difficulties. Low volume and high complexity days were fine in a low stress environment, but poor in a high stress environment. The key control point going forward was to make trading complex products harder in high stress or high volume situations.
While the predictive success was only adequate in the pilot, an R2 approaching 0.5, the approach was seen to have merit and the firm rolled out the PKRI-LI methodology globally across several business units. It was telling that the PKRI-LI approach helped the commodities firm realise the importance of good data collection and use, and to identify areas where data specification, collection, validation and integration could be markedly improved. Multi-variate statistics, such as the use of support vector machines, did not add much value in the early stages; many of the predictive relationships were straightforward, e.g. large numbers of deal amendments lead to later reconciliation problems.
One example of the scientific method being applied to a business problem was in trader training. Trading managers felt that job training was useless, but were afraid to say so in front of the Human Resources team. For trading managers, people either "had it, or they didn’t". For Human Resources almost any process problems required "more training". The hypothesis was "increased training leads to fewer errors". The PKRI-LI approach was to see if low training was predictive of losses and incidents. In the event, the answer was "no". Losses and incidents were fairly random for the first six months of trader employment. Apparently, team leaders weed out poor traders within the first six months of employment. From this point on, till approximately four or five years of trading have passed, training does not correlate with reduced losses or incidents, just poorer profit performance due to days lost in training. After four or five years of employment losses and incidents begin to rise, presumably traders ‘burn out’. But again, increased training made no difference. Human resources countered that perhaps it was the "wrong kind of training". Perhaps, but the trading managers wanted experimental tests of efficacy before rolling out new, costly training programmes – scientific management.
PKRI-LI Issues
There is overlap between KRIs and Key Performance Indicators (KPIs). It would be easy to say that KRIs are forward-looking and KPIs are backward-looking, but far too simplistic. For instance, high trading volumes and high volatility on one day might be good performance indicators predicting a high-likelihood of good future financial performance turnout for that day, but also indicative of emerging operational risks from that day. A KRI such as the number of lawsuits received by a particular function might change very little for long periods. In this case one might wish to examine "lawsuits in period" or "estimated settlement values" or other more sensitive measures than just a very slow-changing "outstanding lawsuits". However, what matters is whether or not the KRI contributes to the capability of predicting operational losses/incidents, not its variability.
KRIs that increase in some ranges and decrease in others can cause confusion as KRIs are not necessarily linear. For example, staff overtime might be an example of a KRI with a bell-shaped curve. No overtime may indicate some level of risk as people aren’t paying attention or do tasks too infrequently; modest levels of overtime may indicate less risk as staff are now doing a lot of familiar tasks; and high rates of overtime may indicate increased risk again through stress. KRIs help to set ranges of acceptable activity levels. There can be step changes in operational risk associated with a KRI. For instance, a handful of outstanding orders at the close of day may be normal, but risk might increase markedly when there are over a dozen outstanding orders. KRIs should vary as risk changes, but they don’t have to vary linearly.
Case Study - European Investment Bank
One European investment bank used three years of data to predict losses/incidents such as deal problems, IT downtime, and staff turnover over a six month period. It achieved reasonable predictive success using multi-variate statistical techniques such as support vector machines, with R2 approaching 0.9 at times, though more frequently 0.6 (i.e. 60% of losses can be predicted). A high-level snippet gives a flavour of the data:
| "Location ID | 1 | 2 | 3 | 4 |
| HR-Headcount # | 136 | 121 | 23 | 30 |
| HR-Joiners in month | 6 | 6 | 6 | 6 |
| HR-Leavers in month | 11 | 11 | 11 | 11 |
| IT-System Disruption Incidents | 2 | 2 | 0 | 0 |
| IT-System Downtime | 35:07:00 | 03:13 | 0 | 0 |
| FO-Trade Volume # | 19218 | 8999 | 661 | 4307 |
| FO-Trade Amendments # | 317.1 | 0 | 8.7 | 80.5 |
| OPS-Nostro Breaks # | 3 | 17 | 3 | 7 |
| OPS-Stock Breaks # | 9 | 4 | 0 | 1 |
| OPS-Intersystem Breaks # | 6 | 2 | 0 | 1 |
| OPS-Failed Trades # | 463 | 26 | 0 | 7 |
| OPS-Unmatched Trades # | 52 | 0 | 7 | 0 |
| RIS-Market Risk Limit Breaches # | 0 | 3 | 0 | 1 |
| AU-High Risk O/S Overdue Audit Issues # | 0 | 0 | 0 | 0 |
| AU-High Risk O/S Audit Issues # | 4.5 | 4.5 | 4.5 | 4.5" |
Note that some of the items in this snippet, e.g. HR joiners/leavers or IT disruption at the system level, can in practice be very hard to obtain. It was also noteworthy that, as a data-driven approach, PKRI-LI projects are only as good as the data put into them – "garbage in, garbage out". In some areas, the data may not be at all predictive. Data quality can vary over time in hard-to-spot ways and interact with wider systems, particularly the people in the systems. For instance, in this trial of PKRI-LI, the IT department was upset at IT downtime being considered a "key risk indicator" and unilaterally changed the KRI to "unplanned" IT downtime, skewing the predicted losses. This change was spotted when using the DAPR system to run the reverse LI-PKRI prediction as a quality control. Another example of Goodhart’s Law, "when a measure becomes a target, it ceases to be a good measure" (as restated by Professor Marilyn Strathern).
What about all the KRI stuff that’s taken for granted? For example, electricity and water supplies may seem to be an important consideration when looking at KRIs for developing world locations, but don’t really feature in criteria for the developed world. In major financial centres, many things are assumed, for instance, an absence of natural threats such as hurricanes or flooding, yet London used to have significant flood risk and may again as the Thames Barrier comes to the end of its projected usefulness. Geologic issues such as earthquake-prone faults or health issues such as malaria don’t seem to feature. There are also numerous personal issues that don’t feature – work permits, opening bank accounts, arranging for utilities, schools, personal safety – any of which could scupper a trading floor. Understandably, people care about those things of which they are conscious. Any of a number of issues could have us looking back several years from and grimly nodding about how trading ceased to function when "people wanted to avoid concentrating terrorism risk" or "infectious diseases just became too dangerous to have people so highly concentrated". The PKRI-LI approach is an approach for regular management, not extreme events.
Adrian Berendt points out that, in operational risk, there is a focus on the known and the known-unknown (those matters that we can comprehend and do something about), at the expense of the unknown-unknown. This may be why businesses focus more on disaster recovery from infrastructure disruption rather than climate change, even if the latter were a larger risk. Events may be viewed as serious if they knock out our single building, but (perversely) less serious if they knock out a whole city. The reasoning - "if there is a catastrophe, our customers will understand that we cannot service them, whereas, if we have had a computer glitch, they will go to our competitors". On global risks, "if the catastrophe is so great that all competitors are affected, nothing we do will make a difference and we won’t be disproportionately disadvantage competitively."
Taleb [Taleb, 2008] cautions us on the limits of statistical methods. Where the distributions are ‘thin-tailed’, i.e. close to normal and not seriously skewed, then statistical techniques work well. There are few ‘black swans’, i.e. more rare events than expected based on historical frequency. Where the payoffs are simple, then approaches such as Environmental Consistency Confidence work well. However, where distribution tails are ‘fat’ and payoffs complex, then statistical methods are fragile and susceptible to rare events. Unfortunately, the abundance of rare events, largely due to the fact that financial markets feed-forward from inter-connected human behaviours, leads people to impugn statistical techniques in finance. Some esoteric risk calculations need extremely long time period data prove that some extreme value calculation is true. If you can get quality data, sometimes it’s provable. More often, when real world data fails to fit, you find that you’ve used the wrong distribution or poor quality data, too late. Rather than abandon all statistics because some extreme cases are problematic, the suggestion should be that people develop extremely strong Environmental Consistency Confidence units, but be clear of their limitations. Other approaches, such as scenario planning or aggregated human judgement, may assist in evaluating rare, complex payoff situations. The frequency of black swan events argues for higher provisioning and increased redundancy regardless of some core numbers that Environmental Consistency Confidence on its own might imply.
What Is Current Practice?
Scientific management of wholesale financial operations is increasing. Managers in many investment banks (e.g. Bank of America, JPMorganChase) have publicly announced their pursuit of 6Σ (Six Sigma) or their adherence to DMAIC or DMADV 6Σ approaches (originally from GE) when they have losses/incidents that they want to eliminate by eliminating root-causes:
DMAIC - Existing Product/Process/Service
| Stage | Objectives |
|---|---|
| Define | Define the project goals and customer (internal and external) deliverables |
| Measure | Measure the process to determine current performance |
| Analyze | Analyze and determine the root cause(s) of the defects |
| Improve | Improve the process by eliminating defects |
| Control | Control future process performance |
DMADV - New Product/Process/Service
| Stage | Objectives |
|---|---|
| Define | Define the project goals and customer (internal and external) deliverables |
| Measure | Measure and determine customer needs and specifications |
| Analyze | Analyze the process options to meet the customer needs |
| Design | Design (detailed) the process to meet the customer needs |
6Σ is clearly related to a dynamic system view of the organisation, a cycle of tested feed-forward and feed-back. This had led to greater interest in using predictive analytics in operational systems management. Several leading investment banks, using 6Σ programmes and statistical prediction techniques (predicting trades likely to need manual intervention), have managed to reduce trade failure rates from 8% to well below 4% over three years for vanilla products. As the cost per trade for trades requiring manual intervention can be up to 250 times more expensive than trades with straight-through-processing transaction, this is a very important cost-reduction mechanism, as well as resulting in a consequent large reduction in operational risk.
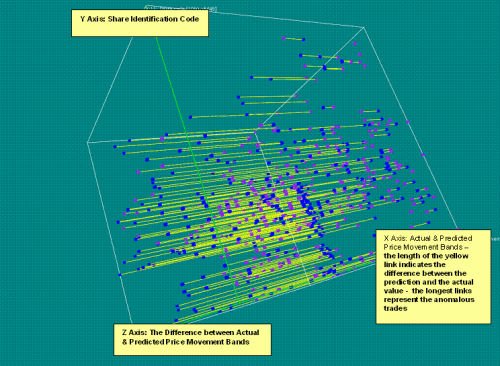
Another approach used in investment banking is predictive analytics. Predictive analytics feature where investment banks move towards automated filtering and detection of anomalies (dynamic anomaly and pattern response - DAPR) [Mainelli, October 2004]. Cruz [2002] notes that a number of banks are using DAPR approaches not just in compliance, but also as operational risk filters that collect "every cancellation or alteration made to a transaction or any differences between the attributes of a transaction in one system compared with another system. … Also, abnormal inputs (e.g. a lower volatility in a derivative) can be flagged and investigated. The filter will calculate the operational risk loss event and several other impacts on the organisation."
Given the impact of the Credit Crunch on trust in all modelling, there is a tendency to assume that all statistical techniques are suspect. Statistical techniques tended to be focused solely on pricing as opposed to operational risk and overall systemic performance. In fact, many of the Environmental Consistency Confidence techniques would have driven financial services people to pay much more attention to costing liquidity risk years ago. [Mainelli, 2007]
Bigger Canvases For Scientific Management
It is a combination of factors that makes a set of KRIs successful, not just a single factor. Jared Diamond derives an Anna Karenina Principle from the opening line of Tolstoy’s novel: "Happy families are all alike; every unhappy family is unhappy in its own way." Diamond believes the principle describes situations where a number of activities must be done correctly in order to achieve success, while failure can come from a single, poorly performed activity. This is certainly the case for KRIs – the evolving set of KRIs is important, not a single one at a point in time, nor too many all the time. This underscores the importance of multi-variate statistics in any real world use of KRIs.
We must not lose sight of the scientific method - our hypothesis is that certain combinations of KRIs predict future losses and incidents, so let’s test those combinations using modern statistical tools. If our environmental factors and activities are consistent with the outcomes, then we can be confident we are tracking the right things. From the fact we are tracking the right factors, we should then develop projects or solutions that eliminate or mitigate the causes. If we fail to predict, we are not tracking the right things and need to explore further, and fairly rapidly as it indicates that things may be ‘out of control’.
When we look at the wider system of wholesale finance we see similar high-level systems that can be predicted, not just risk. The following diagram sets out a simple model of finance as one where risks are selected through positioning and marketing and then priced by attempting to ascertain the difference in value to customers and the cost of capital:
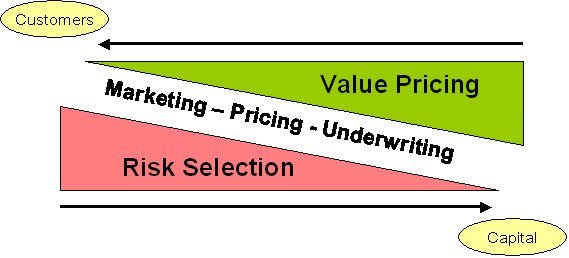
At each point in this abstract model of finance, we can use a KRI system – marketing: can we predict sales; pricing: can we predict profitability; underwriting/trading: can we predict incidents and losses? A KRI system, as with any system, has basic components:
- governance: working from the overall objectives of the business set out a definition of the operational risk framework, the calculation of economic capital and a basic set of essential KRIs;
- input: gaining stakeholder commitment, assembling resources and appointing a team that then work to establish the potential KRIs;
- process: supporting the operational risk managers through data collection, statistical validation, statistical testing, correlations, multivariate prediction, cross-project discussion, training, template materials and methodologies;
- output: evaluating KRIs, focused on a ‘customer’ point-of-view (how does this help me manage my business better), so that people learn from both successes and failures;
- monitoring: providing management information up to governors, over to customers, down to project managers and across project managers so that they are co-ordinated. Monitoring also uses feed-back from KRI outcomes to feed-forward into new KRI ideas and re-plan the shape of the KRI portfolio. An integral part of monitoring is evaluating KRIs at a technical level – do they predict? PKRI-LI prediction is one direction, and LI-PKRI is another.
The KRI System is a classic feed-back and feed-forward cybernetic system. KRIs help managers to manage by reducing the amount of measures they need in both feed-forward and feed-back. So by distinguishing between RIs and KRIs using PKRI-LI Environmental Consistency Confidence help to combat information overload:
"What information consumes is rather obvious: it consumes the attention of its recipients. Hence a wealth of information creates a poverty of attention, and a need to allocate that attention efficiently among the overabundance of information sources that might consume it."
[Simon 1971, pages 40-41]
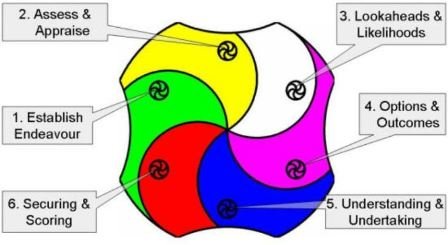
By giving managers a clear focus on the operational risk drivers, they can commission further work to reduce them. The PKRI-LI approach is a dynamic process, not a project to develop a static set of KRIs. This means that a team, possibly aligned with other ‘scientific’ management approaches such as 6Σ, needs to be constantly cycling through an iterative refinement process over a time period. This implies cyclical methodologies for Environmental Consistency Confidence, such as Z/Yen’s Z/EALOUS methodology, illustrated below:
Conclusion
Environmental Consistency Confidence and the PKRI-LI approach is part of a more scientific approach (hypothesis formulation and testing) to the management of risk in financial institutions. "Modern [organization] theory has moved toward the open-system approach. The distinctive qualities of modern organization theory are its conceptual-analytical base, its reliance on empirical research data, and, above all, its synthesizing, integrating nature. These qualities are framed in a philosophy which accepts the premise that the only meaningful way to study organization is as a system." [Kast and Rosenzweig in Open Systems Group, 1972, page 47]
At its root, Environmental Consistency Confidence means building a statistical correlation model to predict outcomes and using the predictive capacity both to build confidence that things are under control, and to improve. Good and bad correlations should raise good questions. Today’s KRI should be tomorrow’s has-been, as managers succeed in making it less of an indicator of losses or incidents by improving the business. Likewise managers have to create new KRIs and validate them. Regulators should be impressed by an Environmental Consistency Confidence approach, but vastly more important is improving the business and reducing risk by putting statistics and science at the heart of financial risk management.
References
- Beer, Stafford, Decision and Control: The Meaning of Operational Research and Management Cybernetics, John Wiley & Sons, 1966 (1994 ed).
- Cruz, Marcello G, "Modelling, Measuring and Hedging Operational Risk", John Wiley & Sons, 2002.
- Howitt, Jonathan, Mainelli, Michael and Taylor, Charles "Marionettes, or Masters of the Universe? The Human Factor in Operational Risk", Operational Risk (A Special Edition of The RMA Journal), pages 52-57, The Risk Management Association (May 2004).
- Mainelli, Michael, "The Consequences of Choice", European Business Forum, Issue 13, pages 23-26, Community of European Management Schools and PricewaterhouseCoopers (Spring 2003).
- Mainelli, Michael "Toward a Prime Metric: Operational Risk Measurement and Activity-Based Costing", Operational Risk (A Special Edition of The RMA Journal), pages 34-40, The Risk Management Association (May 2004).
- Mainelli, Michael, "Finance Looking Fine, Looking DAPR: The Importance of Dynamic Anomaly and Pattern Response", Balance Sheet, The Michael Mainelli Column, Volume 12, Number 5, pages 56-59, Emerald Group Publishing Limited (October 2004).
- Mainelli, Michael, "Competitive Compliance: Manage and Automate, or Die", Journal of Risk Finance, The Michael Mainelli Column, Volume 6, Number 3, pages 280-284, Emerald Group Publishing Limited (June 2005).
- Mainelli, Michael, Gresham College lecture – "Liquidity: Finance In Motion Or Evaporation?" – London, England (5 September 2007).
- Open Systems Group, Systems Behaviour, Harper and Row, 1972, 3rd edn, 1981.
- Simon, Herbert A. (1971), "Designing Organizations for an Information-Rich World" in Martin Greenberger, ed., Computers, Communication, and the Public Interest, The Johns Hopkins Press, Baltimore.
- Taleb, Nassim Nicholas, "The Fourth Quadrant: A Map Of The Limits Of Statistics", Edge, An Edge Original Essay (15 September 2008).
- Vapnik, Vladimir N., Statistical Learning Theory, John Wiley & Sons (1998).
Thanks
I would like to thank Adrian Berendt, Brandon Davies, Christopher Hall, Ian Harris, Matthew Leitch, Jan-Peter Onstwedder, Jürgen Sehnert, Jürgen Strohhecker and Justin Wilson for helping to develop some of the thinking behind this article, though not to claim they agree with all of it.
Professor Michael Mainelli, PhD FCCA FSI, originally undertook aerospace and computing research, followed by seven years as a partner in a large international accountancy practice before a spell as Corporate Development Director of Europe’s largest R&D organisation, the UK’s Defence Evaluation and Research Agency, and becoming a director of Z/Yen (Michael_Mainelli@zyen.com). Michael is Mercers’ School Memorial Professor of Commerce at Gresham College (www.gresham.ac.uk).
Z/Yen is the City of London’s leading think tank, founded in 1994 in order to promote societal advance through better finance and technology. Z/Yen asks, solves and acts globally on strategy, finance, systems, marketing and intelligence projects in a wide variety of fields (www.zyen.com), such as developing an award-winning risk/reward prediction engine, helping a global charity win a good governance award or benchmarking transaction costs across global investment banks. Z/Yen’s humorous risk/reward management novel, Clean Business Cuisine: Now and Z/Yen, was published in 2000; it was a Sunday Times Book of the Week; Accountancy Age described it as "surprisingly funny considering it is written by a couple of accountants".
Z/Yen Group Limited, 5-7 St Helen’s Place, London EC3A 6AU, United Kingdom; tel: +44 (0) 207-562