Best Execution Compliance: New Techniques For Managing Compliance Risk
By
Professor Michael Mainelli, Mark Yeandle
Published by Journal of Risk Finance, Volume 7, Number 3, Emerald Group Publishing Limited, pages 301-312.
Professor Michael Mainelli and Mark Yeandle, The Z/Yen Group
[An edited version of this article first appeared as “Best Execution Compliance: New Techniques for Managing Compliance Risk”, Journal of Risk Finance, Volume 7, Number 3, Emerald Group Publishing Limited (June 2006) pages 301-312.]
[The 'sister' article in the same edition is “Best Execution Compliance: Towards An Equities Compliance Workstation”, Journal of Risk Finance, Volume 7, Number 3, Emerald Group Publishing Limited (June 2006) pages 313-336.]
Feasibility of Best Execution Compliance Automation Using Dynamic Anomaly and Pattern Response Systems
Abstract
Purpose – New regulatory initiatives, principally MiFID and RegNMS, challenge wholesale financial firms to prove that they can provide best execution for their clients. This article outlines the background to the problem and suggests that current research into SVM/DAPR applications may provide a practical approach.
Design/methodology/approach – Desk review of current issues in ‘best execution’ based on work with European brokers and others, followed by initial, promising trial of SVM/DAPR
Findings – Brokers need automated tools, e.g. ‘sifting engines’ that help them to focus compliance efforts on anomalous trades.
Research limitations/implications – Although brokers appear to need assistance in identifying anomalous trades, whether they place significant effort in compliance depends on regulatory enforcement.
Originality/value – MiFID and RegNMS will require changes in current practice. SVM/DAPR approaches appear to be worth further investigation.
Keywords best execution, MiFID, RegNMS, compliance, support vector machine (SVM), equities trading, Dynamic Anomaly and Pattern Response (DAPR), predictive systems, market surveillance.
Paper type - General overview
Summary
The European Union implements the Markets in Financial Instruments Directive (MiFID) on 1 November 2007. Article 21, "Obligation To Execute Orders On Terms Most Favourable To The Client" - ‘best execution’ - of MiFID states:
"Member States shall require that investment firms take all reasonable steps to obtain, when executing orders, the best possible result for their clients taking into account price, costs, speed, likelihood of execution and settlement, size, nature or any other consideration relevant to the execution of the order. … Member States shall require investment firms to monitor the effectiveness of their order execution arrangements and execution policy in order to identify and, where appropriate, correct any deficiencies."
(source: http://europa.eu.int/eur-lex/pri/en/oj/dat/2004/l_145/l_14520040430en00010044.pdf)
In the USA, a similar set of regulations from the Securities and Exchange Commission (SEC), RegNMS, takes effect in 2006 and also requires the ability to demonstrate best execution. The Financial Services Authority (FSA), the financial markets regulator in the United Kingdom, advises ("Planning for MiFID", November 2005, Page 12):
"Firms will need to consider how they will monitor execution performance by the venues included in their policy, and their processes for determining which execution venues to use. They will need to consider the extent to which their existing trading strategies enable them to deliver on these obligations. This could have systems impacts for some firms and generate wider demand for data relating to executions." www.fsa.gov.uk/pubs/international/Planning_mifid.pdf
Most brokers rely on traditional management oversight of the trading process or customer feed-back to control execution quality – but traditional oversight cannot cope with today’s volumes and clients tend to feed back selectively. Many brokers contrast prices obtained in a sample of trades, 1% may be typical according to the British Bankers’ Association, with the published bid-offer spreads available at the time – but then complain that the bid-offer spreads are only a good comparison for very small trades.
What’s missing is the ability to show that a specific trade was executed at a reasonable price taking into account the various characteristics of the trade. In order to comply with MiFID, the only effective method of monitoring thousands or hundreds of thousands of trades per week is to have an automated process identifying a sensible set of anomalous trades for individual examination. Basically, firms need a ‘sifting engine’ that puts forward trades that must be examined – "best execution compliance automation".
In 2004 Z/Yen undertook an informal trial of its PropheZy risk/reward prediction software on bid-offer spreads for the small-cap trades of a broker. This trial indicated that PropheZy might be good at identifying trading anomalies for compliance purposes.
In 2005 Sun Microsystems and the London Stock Exchange, with the cooperation of four brokers, sponsored a detailed, formal trial of PropheZy using three months of 2004 data in order to predict a fourth month, comprising over 190,000 trades with a value of over £54bn. The project objective was to see if PropheZy could predict a number of trade characteristics, in particular the likely price range of a trade (specifically, one of 20 price movement bands on a logarithmic scale). Other characteristics that were tested for predictability included the counterparty to the trade and the share itself (given all the other characteristics).
This project proved that the PropheZy system successfully predicted price movement bands. For instance, by setting the level of acceptable accuracy at "within 0 to 4 bands" out of 20, i.e. 25% on the logarithmic scale, PropheZy was able to predict over 50% of the trades’ price movement bands acceptably. Using these predictions, it was possible to set a level for best execution using price movement band prediction differences, which empirical work set at "investigate trades where the predicted price movement band differs from the actual price movement band by more than 15". This setting resulted in a reasonable subset of anomalous trades for investigation.
For two of the brokers, the PropheZy sift suggested a manageable number of trades for manual investigation. On detailed inspection of the test trades, it was agreed that the system was providing trades worthy of investigation, e.g. spotting a proprietary trade that had been out of normal ranges. For two brokers with higher volumes, a second sift was needed, that of excluding trades that fell within the bid-offer spread available at the time of the trade. This second sift brought the number of anomalous trades within the capacity of available manual inspection and the trades proposed for investigation were worthy of investigation.
PropheZy is a commercial application of a "support vector machine" (SVM), a statistical and information technology approach with applications in numerous areas using wider systems environments that Z/Yen terms dynamic anomaly and pattern response (DAPR). Anomaly detection using PropheZy has wide applicability in a number of trading markets beyond equities, for example foreign exchange, fixed income and commodities. In addition, the sifting approach to identify anomalous trades could be expanded from just price to cost, speed, venue, order fulfilment, client instructions and size.
Best Execution Today
Asset managers increasingly require assurance that brokers are obtaining ‘best execution’. Brokers must evaluate orders received from all customers in the aggregate and periodically assess which competing markets, market makers, or electronic communications networks (ECNs) offer the most favorable terms of execution. Some of the factors a broker needs to consider when executing customers’ orders for best execution include the opportunity to get a better price than what is currently quoted, the speed of execution and the likelihood the trade will be executed. For less-liquid instruments in larger quantities, sell prices will often not be the best price at the time available, while the buy price may be significantly better than the posted price. Price differences can be due to order size, significant market fluctuations, poor liquidity or information leakage. Asset managers who wish to exceed the ‘normal market size’ for an instrument would like to have some assurance that the price ultimately obtained for an abnormal market size is within normal tolerances, but there is a multiplicity of factors affecting price.
As one asset management group explained:
"…[the] issue is one of evidencing to the client that we did in fact achieve the best possible price. Whilst the London Stock Exchange, amongst others, provide tick data pertaining to each price movement throughout the trading day the issue of trading in size will again raise its head. Clearly it is possible to prove the [buy] trade was done within or at the touch price [best price in a particular stock at a given moment in time] but it’s a completely different proposition to prove we achieved the best price".
Best execution compliance processes are particularly important in lower liquidity shares (most often small market capitalisation shares) because the price movements can be significantly influenced by volume.
Many investors have become used to benchmarking against volume-weighted average price (VWAP), which attempts to beat or match the average trading prices in the market over a pre-specified period, ranging from intra-day to a full day. In general, VWAP has become a popular benchmark because investors believe that it is an efficient expression of the trade-off between execution risk and execution impact. Although VWAP is a popular benchmark for clients, most brokers do not consider it to be a useful compliance benchmark. VWAP may not represent the most desirable outcome if, for example, it turns out to be 10% higher than the previous day’s close. Brokers feel that a comparison with VWAP is not sensible because they should be able to beat VWAP. Traders believe they are trying to improve performance over VWAP and establish many reasons why compliance should use a different benchmark. (further background: www.gscs.info/research-tcm-faqs-pf.asp)
The British Bankers Association believe that the vast majority of investment firms in the UK do undertake appropriate and regular execution quality monitoring exercises. The FSA has undertaken some research amongst 20 firms (a mixture of fund managers and brokers) and all but one monitored execution quality. The method they used was sampling a small number of trades (either a sample of 100 trades per month or 1% of trades). There were wide differences of sampling varying from daily to annually. Benchmark measurements used include VWAP, similar trades or comparison with previous close adjusted for market movements. (further background: www.bba.org.uk/bba/jsp /polopoly.jsp?d=155&a=4535)
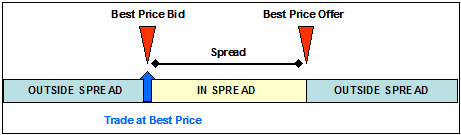
The London Stock Exchange (LSE) Execution Quality Service (EQS) is based on the market’s bid/offer spread at the time of the trade. The price at which a trade is executed is compared with ‘Best Price’ determined by the spread [Diagrams 1 and 2]:
Diagram 1 – LSE definition of best price for buy trades
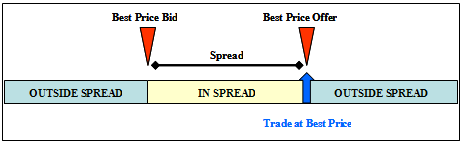
Diagram 2 – LSE definition of best price for sell trades
(source: www.services.londonstockexchange.com/executionquality/resources/EQ%20Service%20description.pdf)
The benchmarks against which the quality of execution can be compared include:
- average value of price improvement per trade (£);
- total value of price improvement (£);
- average basis points price improvement;
- percentage of trades at best price;
- percentage of trades within spread;
- percentage of trades outside of spread;
- average basis points from trade high;
- average basis points from trade low;
- average basis points from mid price high;
- average basis points from mid price low.
The ‘price improvement’ against the best price is assumed to be the most frequent method brokers use to assess execution quality. Comparisons with best bid and best offer prices suffer from the fact that they represent the best that can be achieved and managers consider it unfair to be evaluated against an ideal result. Additionally the volume of business completed at these prices is often small and often less than the trade size of a typical institutional manager who is unlikely to obtain those prices.
The four brokers who participated in this study had fairly limited best execution procedures at present, yet they are broadly in line with the findings of the FSA research mentioned above. One of the brokers uses a system that automatically polls all market makers to find the best price which is then taken for most trades. If several market makers show the same price, then the system allocates the trade based on other preferences. The system automatically checks that the prices entered are within 10% of the previous day’s closing price as a rough best execution and input test – no second checks are deemed necessary.
Two of the brokers have a set of standard terms for customers (including intermediate customers). These terms contain an opt-out clause allowing the broker to avoid current best execution rules. Many customers do not re-negotiate these terms even though they are entitled to. Most of their clients have accepted opt-out clauses in relation to best execution compliance. One of the two brokers asks counterparties with whom it deals to sign quarterly declarations about the quality of their execution.
Another broker believes in market forces - the main motivation for them to achieve best execution is that if they don’t provide clients with what clients believe to be competitive prices, their clients will give business to other brokers.
One of brokers has recently implemented a new proprietary system to monitor best execution. It is too early to assess the effectiveness of this system. Best execution was not monitored by this broker prior to this new system.
Future Regulatory Environment – RegNMS and MiFID
Compliance costs are already significant. The top 1,000 US corporations are spending on average $5.1 million on just Sarbanes-Oxley compliance, according to Korn/Ferry.
"Up to 15% of support staff at Dresdner Kleinwort Wasserstein are working on compliance projects or financial regulations, Stephen Ashton, director of global IT business management at the investment bank, revealed last week." [Computer Weekly, 1 February 2005]
"Regulatory controls take up a sizeable proportion of spend. Basel 2 and Sarbanes-Oxley compliance is chewing up 40% of investment spend." Kevin Lloyd, Barclays CTO [Computer Weekly, 15 June 2004]
The financial services industry needs to find ways to automate compliance, or risk becoming far less competitive [Mainelli, 2005]. Further, two new sets of regulations, RegNMS in the USA and MiFID in Europe, increase the regulatory burden of checking trades for best execution. Sun Microsystems provides a summary of RegNMS and MiFID [Table 1].
| RegNMS | MiFID | |
|---|---|---|
| Planned implementation date(s) |
Trade-through testing April 2006 Phase 2 in November 2007 |
November 2007 |
| Key regulatory authority | SEC | EU |
| Objectives |
- best execution on key equity markets - fairer access and new rules for price quotes - changes to market data handling |
- investor protection - best execution - enhance transparency - improve order execution - bolster market integrity and efficiency |
| Technology Impact |
- sophisticated order routing - compliance tools - market data applications - cross venue capabilities |
- trading & order routing - regulatory reporting - archive/historic pricing - customer management trade reporting - market data - reference data - compliance tools |
| Likely Market Impact |
- significant impact on established exchanges - increased importance of cross venue utilities |
- increased concentration on sell side. - increased competition for established exchanges leading to increased pressure for pan-European exchange? - pressure to split exchange & clearing services |
| Estimated costs | $544m information technology costs over the next four years | €1bn |
The Problem
There is reasonable agreement among financial services firms and regulators that both buy-side and sell-side firms need best execution compliance processes that monitor execution quality. However, there is little agreement about parameters for the process. Z/Yen’s financial services work shows a range of just cash equity transactions among major banks ranging from 1 million to over 40 million transactions per year. A Tier 2 investment bank might conduct 250,000 European equity trades per week. In such an environment, the Tier 2 investment bank will need to show that it obtained a suitable price, chose a suitable market and traded within a number of other client parameters. It is fairly clear that showing this evidence post facto cannot be done manually. It is also fairly clear that claiming that the investment bank has "stated policies" is also insufficient evidence. So there needs to be some mechanism whereby the investment bank can assure regulators that they investigate anomalies.
A number of compliance issues might be settled fairly straightforwardly, e.g. that highly liquid equities are traded on their home markets’ order books or that trades within the bid-offer spread are acceptable, although even these simplifications raise issues about achieving best execution. If these simplifications reduced the Tier 2 investment bank to 75,000 trades per week requiring compliance checks, that is still far too high a number for weekly verification. If the investment bank then tries to reassure regulators that it has a method of ‘sifting’ trades to get down to a reasonable number for investigation, the regulators will, quite rightly, question the parameters.
Current best execution benchmarks for clients are not particularly suitable for compliance purposes for brokers, and anyway result in a large number of ‘false positives’, i.e. far too many trades that deviate from the norm [Table 2]. For example, if VWAP movement is used to find outliers – using 10 equal bands of VWAP movement on our project’s data would place 36% of all trades in the top and bottom bands.
Table 2 – VWAP movement as a detector of outliers
| VWAP movement band | 1 | 2 | 3 | 4 | 5 | 6 | 7 | 8 | 9 | 10 |
|---|---|---|---|---|---|---|---|---|---|---|
| % of trades in each band | 16% | 2% | 4% | 6% | 17% | 21% | 7% | 4% | 3% | 20% |
| % of trades in each band outside bid/offer spread | 7% | 1% | 2% | 2% | 7% | 9% | 3% | 2% | 1% | 9% |
If the project data is filtered to just trades outside the bid/offer spread, it still leaves 16% of trades as outliers – too many for manual investigation. What is needed is an analytical approach that ‘sifts’ through trades and identifies the truly anomalous for further investigation.
The future of risk-based compliance might well be:
- developing an acceptable framework process of ‘sift’ & investigate, while also including some random evaluation;
- showing that the sift method is ‘neutral’ for the market and the broker (the proposal is to apply SVMs, of which more later);
- working in a cooperative manner to share the parameters for ‘sifting’ so that regulators do not feel that the parameters are set to suit the compliance resource available or to evade oversight.
Ideally, the combination of a set of randomly selected trades and automatically-identified trades for investigation based on anomalous characteristics would be a very small subset of the total trades, e.g. less than 1%. That would leave a Tier 2 investment bank investigating perhaps 2,500 trades per week at worst.
Informal Trial
During August and September 2004, Z/Yen undertook an informal trial of its risk/reward prediction software, PropheZy, for off-book trades which indicated potential for using the software to provide ‘best execution’ monitoring. PropheZy is support-vector-machine-based and works by building a dynamic SVM/DAPR application using the most up-to-date information, typically trade information up to that day. This informal trial used one firm’s trading data along with London Stock Exchange tick data. PropheZy appeared to focus on a reasonable subset of trades worthy of further investigation, as opposed to generating too many false positives for investigation.
The informal trial showed that a training set of 2,700 trades could be used for reasonable predictions of outliers on a test set of 450 trades. PropheZy built a SVM/DAPR application that identified 55 trades as anomalous. This might be seen as likely to be too many trades for effective sifting, i.e. over 10%, but 53 of the trades turned out to be internal book adjustments, so in actuality there were 2 trades out of 450 worth investigating, less than 0.5%. The 55 anomalous trades are presented using PropheZy’s visualisation suite, VizZy [Diagram 3]. VizZy also permits ‘drilling in’ to see the specifics of each trade anomaly.
Diagram 3 – A 3-dimensional VizZy presentation of 55 anomalous trades
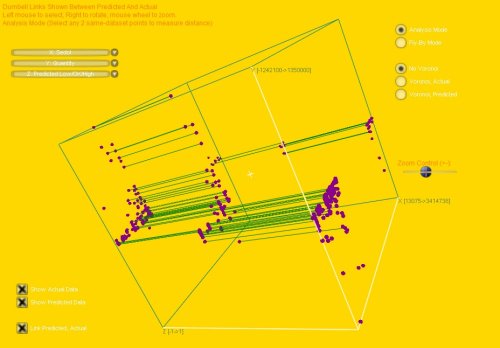
The diagram shows the 450 trades in total, both the actual price and the predicted price. The 55 green bars show where the prediction was that the trade should have occurred within the bid-offer spread but didn’t, i.e. a better price might have been obtained.
Research Project Objective
In 2005 a joint research project was agreed between the London Stock Exchange, Sun Microsystems and Z/Yen Limited. The primary objective was to investigate the feasibility of using support vector machine & dynamic anomaly and pattern response (SVM/DAPR) techniques to automate the detection of best execution anomalies for management investigation. To meet this objective, the research would also compare the results of the SVM/DAPR technique with current techniques such as VWAP and comparisons with the current best price. The research would also evaluate how useful SVM/DAPR techniques are in providing a tighter set of trades for further investigation.
Some of the questions that the research attempted to answer are:
- How large is the universe of anomalous trades?
- Using SVM/DAPR techniques, how many trades actually warrant investigation and what proportion of the universe do these represent?
- What do firms do now to monitor the execution quality?
- Could a SVM/DAPR approach provide a benchmark for measuring best execution better than VWAP comparisons with best price?
The "null hypothesis" was effectively that automated sifting and selection will be unable to identify potentially anomalous trades any better, if at all, than existing processes.
The research has shown that best execution compliance automation appears feasible at a reasonable cost (see Best Execution Compliance Automation - Towards An Equities Compliance Workstation). Nevertheless, this is hardly the end of the matter.
Areas for Further Research
Using SVMs as ‘sifting’ engines to identify anomalies for further investigation clearly has merit. For the purist, which might well include many in the capital markets community, virtually no amount of evidence is sufficient to prove that the approach is valid. In fact, the ‘strong markets hypothesis’ questions any notion that historic trading can help to predict future trading. However, as this research demonstrates, the SVM is capable of reasonable levels of prediction, in this case price movement, and, in the future, other best execution parameters, so it is a useful sifting tool.
Nevertheless, this research was constrained by scope, time, budgets and data. During the course of the research a number of areas for useful further research arose but could only be noted, including:
- external parameter inclusion: the research concentrated largely on the data to hand. A few external items, such as the general market direction, were added to the data available from the brokers. Quite a few ‘environmental’ parameters could be added, e.g. dividend dates, corporate announcements, extra-national holidays or government tax changes. It is highly likely that some of these external parameters could significantly improve predictability, and thus anomaly detection;
- data that becomes available after the time of the trade could be incorporated into models for later analysis by Compliance – this could include, date and time of trade publication, settlement date, the closing price on the day of the trade, settlement difficulties and the return versus the closing price;
- volume and liquidity data: related to the times series parameters point above, a lot more work could be done on intraday volume and liquidity. Liquidity is a slippery concept, but it is clear that the prediction of price movement bands depends on liquidity. This project used relatively static measures of liquidity such as the ratio of traded value to market capitalisation. There are, though, potential intraday volume and liquidity combinations that might improve results;
- fractal and other non-linear parameters: there is great potential in using some of the non-linear measures from ‘Chaos Theory’, e.g. Mandelbrot’s fractal dimension or the Hurst Exponent, as input parameters to the SVM. This is a research area that the current team intend to explore;
- time series parameters: there is an infinite set of possible time series parameters that could be used. The simplistic SVM approach relies on every relevant predictive input being available as a single data record. This requires the analyst to provide all relevant predictive inputs. Time series data though can be infinite, e.g. hourly moving averages, daily, weekly, different moving average calculations, different moving average weightings, different moving average time periods, etc. It is possible that other teams will achieve better results with different parameters. It is also an area for research, beyond the scope of this study, of developing theoretical frameworks that optimise time series parameter selection;
- sensitivity analysis: while some sensitivity analysis was conducted, showing that the key variables affecting PropheZy’s predictive effectiveness were the:
- percentage of liquidity of the trade;
- underlying index movement between the previous trade and the current trade;
- price volatility of the share;
- time since the last trade;
- mid-price at the time of the trade;
- much more rigour and investigation could be applied;
- time periods: there was simply not enough time to test the SVM approach for an optimal time period. It is clear that there is some predictive capacity over time periods as long as a month. It is also clear that the SVM model shows some degradation over the course of a day. For compliance purposes a twice-per-day re-build seems appropriate, but more research could help to improve this rule of thumb;
- SVM variants: SVM types and other kernel methods may increase accuracy slightly;
- learning from investigations: this approach has the potential to use compliance investigations to build a second sift that would further successfully narrow the number of anomalous trades, however this is likely to require a few months of regular use;
- moving closer to real-time: there is no reason in principle why this approach to compliance could not operate closer to real-time, i.e. at the time a trade is entered. However, this research was only backtesting. The Sun Solaris platform should be capable of enabling close to real-time operation in practice;
- data collaboration: it is likely that this approach would benefit through sharing data, appropriately anonymised. For instance, firms could share parameters that seem useful, e.g. time period for training sets, accuracy decay, variable sensitivities. As mentioned above, it would also be of immense to help to develop a dataset or datasets that industry players agreed constituted a reasonable set of training data containing anomalies they would expect it to identify;
- applications in other markets: this technique can clearly be used in a number of other markets to build similar compliance workstations. This research focused on equities because of the current regulatory focus on equities in current and impending legislation. It is clear that, at least, European regulators are looking to explore the application of best execution compliance requirements to other asset classes and have specifically named fixed income, commodities and foreign exchange as worthy of future consideration for similar best execution requirements. The SVM approach to best execution compliance automation should work in a comparable manner in those markets.
Conclusion
Building a best execution compliance workbench using SVM/DAPR appears to be feasible. While further testing and calibration would help to improve this application of SVM/DAPR, this approach is already likely to be of use to organisations in the capital markets, viz.:
- brokers: brokers can implement the compliance workstation that has been built, both to reduce cost but also for competitive advantage in attracting business;
- regulators: with some modifications and enhancements, e.g. taking advantage of the privileged central view some regulators enjoy, could apply the SVM/DAPR approach to market surveillance;
- exchanges: while brokers with large numbers of trades across different markets will probably need to implement on-site systems, exchanges have an opportunity to develop new revenue sources or improve services by providing ‘black box’ compliance systems and services to members, primarily smaller members.
We recommend further research and investigation with more brokers and investment managers with prototypes moving closer to real-time anomaly identification in order to better manage compliance risk.
References
Mainelli, Michael, "Competitive Compliance: Manage and Automate, or Die", Journal of Risk Finance, The Michael Mainelli Column, Volume 6, Number 3, pages 280-284, Emerald Group Publishing Limited (June 2005).
Vapnik, Vladimir N., Statistical Learning Theory, John Wiley & Sons (1998).
Professor Michael Mainelli, PhD FCCA FCMC MBCS CITP MSI, originally did aerospace and computing research followed by seven years as a partner in a large international accountancy practice before a spell as Corporate Development Director of Europe’s largest R&D organisation, the UK’s Defence Evaluation and Research Agency, and becoming a director of Z/Yen (Michael_Mainelli@zyen.com). Michael was awarded IT Director of the Year 2004/2005 by the British Computer Society for Z/Yen’s work on PropheZy. Michael is Mercers’ School Memorial Professor of Commerce at Gresham College (www.gresham.ac.uk).
Mark Yeandle, MBA BA MCIM MBIM, originally worked in consumer goods marketing and held senior marketing positions at companies including Liberty and Mulberry. His experience includes launching new brands, company acquisitions & disposals and major change management programmes. Mark has been involved in many of Z/Yen’s recent research projects including a resourcing study, an anti-money laundering research project, and an evaluation of competitive stock exchange systems. Mark has also been closely involved with the testing and use of PropheZy in marketing applications.
Z/Yen Limited is the UK’s leading risk/reward management firm, helping organisations make better choices. Within Financial Services Z/Yen performs benchmarking and performance analysis, market surveys, strategic planning, market intelligence, change management and project management. Z/Yen’s benchmarking work encompasses European securities, US securities, global derivatives processing, global foreign exchange and money markets, clearance and settlement and operational performance. Z/Yen’s operational improvement work covers systems, people and organisation. Z/Yen received a Foresight Challenge Award in 1997 for its work on the £1.9million Financial £aboratory researching the visualisation of financial risk and a DTI Smart Award 2003 for the risk/reward prediction engine, PropheZy. For more information see www.zyen.com.[An edited version of this article first appeared as “Best Execution Compliance: New Techniques for Managing Compliance Risk”, Journal of Risk Finance, Volume 7, Number 3, Emerald Group Publishing Limited (June 2006) pages 301-312.]