Best Execution Compliance Automation: Towards An Equities Compliance Workstation
By
Professor Michael Mainelli, Mark Yeandle
Published by Journal of Risk Finance, Volume 7, Number 3, Emerald Group Publishing Limited, pages 313-336.
Professor Michael Mainelli and Mark Yeandle, The Z/Yen Group
[An edited version of this article first appeared as “Best Execution Compliance: Towards An Equities Compliance Workstation”, Journal of Risk Finance, Volume 7, Number 3, Emerald Group Publishing Limited (June 2006) pages 313-336.]
[The 'sister' article in the same edition is “Best Execution Compliance: New Techniques for Managing Compliance Risk”, Journal of Risk Finance, Volume 7, Number 3, Emerald Group Publishing Limited (June 2006) pages 301-312.]
Feasibility of Best Execution Compliance Automation Using Dynamic Anomaly and Pattern Response Systems
Abstract
Purpose – Requirements in MiFID and RegNMS mean that buy-side and sell-side firms need to find ways of showing regulators that they are sifting through their trading volumes in a justifiable, methodical manner looking for anomalous trades and investigating them, in order to prove ‘best execution’. The objective was to see if a SVM/DAPR approach could help identify equity trade anomalies for compliance investigation.
Design/methodology/approach – A major stock exchange, a computer systems supplier, four brokers and a statistical firm undertook a co-operative research project to determine whether automated statistical processing of trade and order information could provide a tighter focus on the most likely trades for best execution compliance investigation.
Findings – The support vector machine approach worked on UK equities and has significant potential for other markets such as foreign exchange, fixed income and commodities.
Research limitations/implications – The research has implications for risk professionals as a generic approach to trading anomaly detection. The prototype compliance workstation can be trialled.
Originality/value – Automated anomaly detection could transform the role of compliance and risk in financial institutions.
Keywords - best execution, MiFID, RegNMS, compliance, support vector machine (SVM), equities trading, Dynamic Anomaly and Pattern Response (DAPR), predictive systems, market surveillance.
Paper type - Research Paper
Research Project Objective
In 2005 a joint research project was agreed between the London Stock Exchange, Sun Microsystems and Z/Yen Limited. The primary objective was to investigate the feasibility of using support vector machine & dynamic anomaly and pattern response (SVM/DAPR) techniques to automate the detection of best execution anomalies for management investigation (see Best Execution Compliance, New Techniques for Managing Compliance Risk). To meet this objective, the research would also compare the results of the SVM/DAPR technique with current techniques such as VWAP and comparisons with the current best price. The research would also evaluate how useful SVM/DAPR techniques are in providing a tighter set of trades for further investigation.
Some of the questions that the research attempted to answer are:
- How large is the universe of anomalous trades?
- Using SVM/DAPR techniques, how many trades actually warrant investigation and what
proportion of the universe do these represent? - What do firms do now to monitor the execution quality?
- Could a SVM/DAPR approach provide a benchmark for measuring best execution better than VWAP comparisons with best price?
The “null hypothesis” was effectively that automated sifting and selection will be unable to
identify potentially anomalous trades any better, if at all, than existing processes.
Approach
Research Team
Research team roles were allocated to:
- London Stock Exchange, who provided Execution Quality Service and tick data, as well as help in recruiting members as participants;
- Sun Microsystems, who provided direct financial backing and further services and equipment, particularly Sun Solaris equipment for large volume SVM/DAPR;
- Z/Yen, who provided PropheZy and VizZy, as well as project management and researchers to build the SVM/DAPR systems and conduct the data trials. A Z/Yen director, Michael Mainelli, was the principal point of contact for the research project and Mark Yeandle was the Project Manager.
Overall Approach
Following an informal trial in 2004, this research project was conducted from June to December 2005 after the team recruited four brokers prepared to examine off-book equity trades. The research began by surveying participants’ existing approaches to best execution compliance. The team then built SVM/DAPR systems for each broker taking three months of trading data for training in order to test a fourth month of data for anomalous trades. The research team sent back to each broker a set of trades that the SVM/DAPR system identified as worth being investigated. The key criterion for investigation was that the trade price seemed anomalous. The research team then worked on contrasting the SVM/DAPR output with alternative methods of identifying outliers. These alternatives included:
- VWAP;
- best price at the time of the trade;
- cluster analysis.
Methodology
The research followed an overall methodology as follows, though many tasks were conducted in parallel:
- review of previous relevant research;
- recruit four participants;
- outline the data requirements;
- assess current best execution monitoring practices;
- collect data from the brokers and the LSE;
- analyse, validate and & pre-process the data;
- build trial SVM/DAPR systems for various parameters to ensure historic data has predictive capacity;
- select approach to anomaly identification and build full SVM/DAPR systems;
- develop visualisations of a possible compliance workstation;
- feedback data and visualisations to the participants;
- collect feedback from the participants;
- prepare final research document for publication.
Participants
The four brokers who participated in the research provided:
- staff time to explain current best execution compliance approaches, factors, coefficients and benchmarks;
- a dataset of four months’ off-book and on-book equities trading data (September through December 2004);
- staff time to investigate a sample of trades that the SVM/DAPR approach found anomalous.
The research team agreed to keep the identities of the participants confidential. Their profiles are:
- Broker A is an independent UK-based firm offering stockbroking services, asset management and financial planning advice to members of the public;
- Broker B is a USA-based global investment bank serving corporations, institutions, governments and high-net-worth investors worldwide;
- Broker C is an Asian-based financial services group engaged in four main business areas - Global Markets, Investment Banking, Merchant Banking and Asset Management;
- Broker D is a European-based global investment bank and asset management business dealing with individuals, corporations, the public sector and other not-for-profit organisations.
In return for participating in this research the brokers received:
- research results including working documents not subject to confidentiality;
- a presentation of the approach and results for their business;
- an example of a SVM/DAPR system on their data and sample visualisation of their data in a prototype compliance workstation.
PropheZy, A Support Vector Machine/Dynamic Anomaly and Pattern Response (SVM/DAPR) Implementation
This study used classification and prediction tools based on SVM mathematics to undertake predictive analysis of the data. SVMs are algorithms that develop classification and regression rules from data. SVMs result from classification algorithms first proposed by Vladimir Vapnik in the 1960’s, arising from his work in Statistical Learning Theory [Vapnik, 1995, 1998]. SVMs are based on some wonderfully direct mathematical ideas about data classification and provide a clear direction for machine learning implementations. While some of the ideas behind SVMs date back to the 1960’s, computer implementations of SVMs did not arise until the 1990’s with the introduction of a computer-based approach at COLT-92 [Boser, B., Guyon, I. and Vapnik, V., 1992].
SVMs are now used as core components in many applications where computers classify instances of data (e.g. to which defined set does this group of variables belong), perform regression estimation and identify anomalies (novelty detection). SVMs have been successfully applied in time series analysis, reconstructing chaotic systems and principal component analysis.
SVM applications are diverse, including credit scoring (good or bad credit), disease classification, handwriting recognition, image classification, bioinformatics and database marketing, to name a few.
SVMs are said to be independent of the dimensionality of feature space as the main idea behind their classification technique is to separate the classes in many data dimensions with surfaces (hyperplanes) that maximise the margins between them, applying the structural risk minimisation principle. The data points needed to describe the classification algorithmically are primarily those closest to the hyperplane boundaries, the “support vectors”. Thus, only a small number of points are required in many complex feature spaces. SVMs can work well with small datasets, though the structure of the training and test data is an important determinant of the effectiveness of the SVM in any specific application.
SVMs compete forcefully with neural networks as well as other machine learning and data mining algorithms as tools for solving pattern recognition problems. Where SVMs do not perform well it is arguable that the algorithmic rules behind the support vector algorithm do not so much reflect incapabilities of the learning machine (as in the case of an overfitted artificial neural network) as much as irregularities of the data. In short, current opinion holds that if the data in the domain is predictive, SVMs are highly likely to be capable of producing a predictive algorithm. Importantly, SVMs are robust tools (understandable implementations, simple algorithmic validation, better classification rates, overfitting avoidance, fewer false positives and faster performance) in practical applications. “The SVM does not fall into the class of ‘just another algorithm’ as it is based on firm statistical and mathematical foundations concerning generalisation and optimisation theory” [Burbridge & Buxton, 2001]. However, comparative tests with other techniques indicate that while SVMs are highly likely to be capable of predicting, in some applications SVMs may not be the best approach for any specific dataset. “In short, our results confirm the potential of SVMs to yield good results, especially for classification, but their overall superiority cannot be attested” [Meyer, Leisch, Hornik, 2002].
PropheZy and VizZy are two software packages developed by Z/Yen for classification and visualisation of data. Together they constitute a SVM/DAPR environment. PropheZy implements a SVM on a server (though it can be used in a local client/server mode). Naturally, as in any field of computing, there are a number of variant SVM implementations, of which PropheZy implements three types - C-SVC, nu-SVC and binary. Further, of statistical importance in replicating results is the “kernel function”. PropheZy implements four types of kernel function - linear, radial basis function, sigmoid and polynomial. The SVM types and kernel function types are described in detail in Vapnik [1995, 1998]. For this study, the SVM implementation used was C-SVC and the kernel function was linear.
So far, the PropheZy server SVM has been implemented on a Linux server, a Sun Solaris server and a Windows NT server. PropheZy implements the user-interface to the server SVM via XML (extensible mark-up language). The XML user-interface can be via an HTML page, directly through a bulk file loader command line or by use of an Excel add-in that performs XML data submission from spreadsheets to the server SVM and displays results back in Excel spreadsheets. For this study, the PropheZy implementation was the Sun Solaris server using a bulk file loader command line. VizZy provided visualisation of clustering, histogram, Voronoi and data cube diagrams from tabular data output by PropheZy.
Z/Yen has benchmarked PropheZy against standardised machine learning tests, e.g. appropriate StatLog test sets [Michie, Spiegelhalter and Taylor, 1994], in order to validate the SVM with good to excellent results. Z/Yen has trialled PropheZy extensively in financial services applications and sees great promise for SVMs and other Dynamic Anomaly and Pattern Response (DAPR) techniques in areas such as compliance [Mainelli, 2005], trade anomaly detection and scorecards [Mainelli, 2004] as well as regression and value prediction [Mainelli, Harris and Helmore-Simpson, 2003].
Data
For the purposes of this research, a discrete, easily quantifiable and readily obtainable set of data was required. SETS - The London Stock Exchange’s trading service for UK blue chip securities is an electronic order book that can execute hundreds of trades a second. Securities traded on SETS include all the FTSE 100 securities, the most liquid FTSE 250 securities along with some others. The prices quoted on SETS are the best available at the time and as such trades fulfilled ‘on-book’ might be viewed as representing best execution. However, SETS-traded equities are also regularly traded outside the electronic order book (‘off-book’ trades).
The research team decided that they should look at off-book trades of SETS securities as this was the area requiring proof of best execution. A large number of trades are conducted off-book and it is often these trades that attract attention from compliance departments. There are a substantial number of these trades that occur outside the current bid/offer spread. This is usually for a very good reason – typically the size of the trade (in relation to the usual size of trades in that security) or specific client instructions regarding timing of execution.
The total number of trades included within the research was approximately 190,000 with a value of over £54bn. These were from four brokers and covered their off-book trades from September 2004 to December 2004 inclusive. It should be noted that although exchange traded securities were selected as an ideal dataset for this research, the information used in building the model was only that which would be available for non-exchange traded instruments.
Data Preparation & Validation
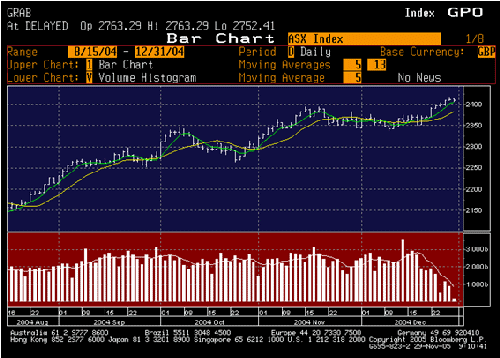
Each of the four participants provided large text files containing details of their off-book trades for the four months from September 2004 to December 2004 inclusive. The first thing that the research team did was to validate this data with the data provided by LSE. The team also studied the movement of the market in general over the period [Diagram 1] in order to establish overall volume and price patterns.
Diagram 1 – Movement of the All Share Index September to December 2004
From the data supplied by all parties, the team generated files of transactions with the following fields (* indicates that the data was codified into numeric values from text):
- SEDOL code (share code, e.g. 0316893 = Eurotunnel);*
- market segment of share (e.g. pharmaceutical, retail);*
- trade date;
- trade time;
- trade size;
- trade price;
- trade code;
- buy/sell indicator (buy=1, sell=0);*
- participant code buyer (counterparty);*
- participant code seller (counterparty); *
- settlement due date.
The following fields were then added:
- market sector (e.g. FTSE 100, FTSE 250 - downloaded from LSE website);*
- day of the week (1 to 5 - derived from date);
- closing price for the previous 10 days;
- inside (0) or outside (1) the bid/offer spread;
- consideration (a calculated field - price multiplied by the quantity of shares);
- 5 day % price movement (calculated fields);
- bid price (from LSE files – linked using SEDOL Code);
- mid price (from LSE files – linked using SEDOL Code);
- offer price (from LSE files – linked using SEDOL Code);
- VWAP movement (calculated previous trades executed by each firm within the previous 5 days);
- F.T.S.E. Index movement (of the relevant index for the share) since the last trade;
- price volatility - the standard deviation of the closing prices of the previous 12 days (12
days based on discussions with market participants and previous research); - % size of bid/offer spread;
- liquidity (average number of shares traded per day, over the 88 trading days between
September and December); - return versus mid price (trade price – mid price) / mid price;
- return versus previous closing price (trade price – previous closing price) / previous
closing price; - % of liquidity of the trade (trade size / liquidity);
- 3 day index movement for the index in which the share is listed;
- number of trades in a day- for each share and each day;
- time since last trade- the number of 10 minute slots since the previous trade of that share
by that broker; - day of the week of the last trade (1 to 5) - when the share was last traded by that broker.
Compliance Workstation Prototype
During the course of the project the team built a prototype “Compliance Workstation”. The Compliance Workstation combined a number of software tools, PropheZy, VizZy, FractalEdge and Decisionality within an Excel framework. The Compliance Workstation provided a number of features, specifically the ability to:
- construct predictive tests on any trade characteristic in order to spot anomalies;
- spot anomalies using cluster analysis;
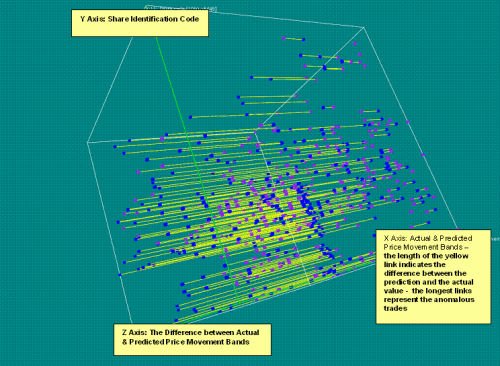
display the results visually, specifically showing predicted versus actual differences in three dimensions. Diagram 2 shows a visualisation with the predicted price movement bands in blue plotted against the actual price movement band in purple. The length of the yellow link shows the difference between the actual and predicted values.
Diagram 2 – A 3-dimensional VizZy presentation of anomalous trades
- provide a ‘drill down’ tool for a compliance officer to home in on specific trades. This tool, Fractal Intelligence, allows the user to drill down through a variety of hierarchies. Diagram 3 shows a set of sell trades that fell outside the bid/offer spread and is arranged in 10 circles, starting clockwise from the top showing trades with increasing differences between actual and predicted price movement bands.
Diagram 3 - A ‘drill-down’ and data visualisation tool showing anomalous trades

Initial Tests of Predictive Capability
The research team initially conducted a range of tests on the data to assess the predictive capacity of the data. Many of the heuristics used in the construction of these tests were informed by previous studies of share price prediction [Cao & Tay, Huang, Nakamori & Wang], as well as previous Z/Yen client work on share liquidity and other analyses.
The first set of tests used the SVM to predict the counterparty with which each transaction was conducted. This was conducted on two datasets. (1) In the first dataset there were 52 different counterparties and the SVM was able to correctly predict the counterparty in over 43% of the trades tested. (2) In the second dataset there were 11 different counterparties and over 61% were correctly predicted.
The second set of tests used the SVM to predict the share that was traded in each transaction. This was again conducted on two datasets. (3) In the first dataset there were 150 different shares and the SVM was able to correctly predict the share in nearly 8% of the trades tested. (4) In the second dataset there were 82 different shares and over 18% were correctly predicted.
One question was whether the predictions made by the SVM were different to those that could have been made by a simpler method, a “naïve classifier”. The team compared the SVM output with a random classification based on the observed probabilities of each class. This was done by conducting a statistical significance test based on Liddell’s exact test for paired proportions [Liddell, 1983], which examines the difference between the two alternatives by looking at where each method was correct when the other was incorrect. The tests show that for Broker’s A, B and D, there is significant evidence that the predictions made by the SVM are much better than those that would be made by a naïve classifier. The evidence for Broker C (a much smaller dataset) was weaker, but nevertheless supported the performance of the SVM.
A third set of tests were run were to see whether the SVM could predict how much the VWAP of a share would move. For this set of tests, VWAP movement was banded into twenty equal bands across the range of VWAP, between -0.3% and +0.3% movement, with each band having a size of 0.03%. Tests conducted by building a SVM with three months’ data were significantly more accurate than those built with only one month’s data. Increasing the dataset to four months gave no significant increase in accuracy. (5-8) The team therefore ran all datasets using a three month history to train the SVM. The average accuracy over all four brokers was over 25%. Over 52% of predictions were within 4 bands.
The conclusion was that the data did have predictive capacity when used by a SVM.
Results & Analysis
Price Movement Band Tests
After conducting a number of trial tests and speaking to several industry experts, the research team decided that the most relevant test was to predict price movement. In order to keep the SVM construction and the analysis simpler, the team calculated twenty price movement bands. First, the team calculated the percentage by which a share price had moved between the trade in question and the previous trade. Then the team calculated the natural logarithm of the absolute price movement. Using the mean and standard deviation of all price movement logarithms in the training set, the team created a normalised price movement variable by subtracting the mean value from each observation and dividing by the standard deviation. Based on these normalised variables, the trades were split into twenty equal price movement bands, with the probability of any trade being in any particular band at 5%. By using this method of banding, the trades with the largest share price movements fall into the highest bands and the trades with the smallest movements are contained in the lowest bands.
Tests were then conducted using three months of data to train the model and perform price movement band predictions for trades on the following day (the first test used 1 September to 1 November as a training set and predicted 1 December; the second test used 2 September to 1 December as a training set and predicted 2 December, etc.). This ‘rolling’ approach covered the 21 trading days of December 2004.
The team looked at the predictions of price movement band and compared these to the actual price movement band. The overall results were that over 9% of records were predicted correctly, 47% were within 4 bands, 74% were within 9 bands and 93% were within 14 bands. After examination and discussion with industry experts, the trades where the prediction differed from the actual result by 15 bands or more were defined as ‘outliers’. On average 7% of trades were statistically anomalous or ‘outliers’. If all statistically anomalous trades that were transacted at ‘best’ price (or better) are excluded, only 1% of all trades remain for possible investigation. The daily results for each of the four brokers are shown in both tabular [Tables 1, 2, 3, 4] and graphical form [Charts 1, 2, 3, 4]. The accuracy of the SVM at correctly predicting the exact price movement band out of 20 varies between 8% and 11.75% for the different brokers. The accuracy of the SVM at predicting within 4 price movement bands varies between 45% and 56% for the different brokers.
Table 1 – Analysis of the 21 price movement band tests for Broker A (21 trading days in December 2004)
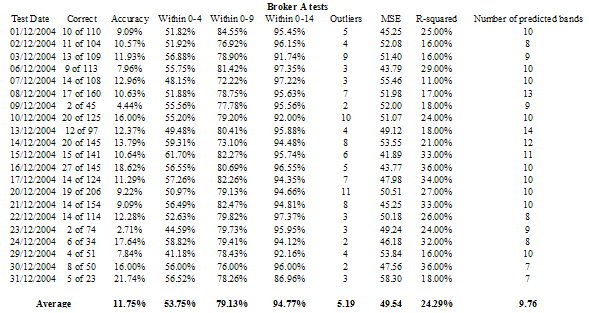
Chart 1 – Differences for Broker A between actual and predicted price movement bands – out of 20 bands – yellow line shows the % of ‘outliers’, trades where the difference is 15 or more
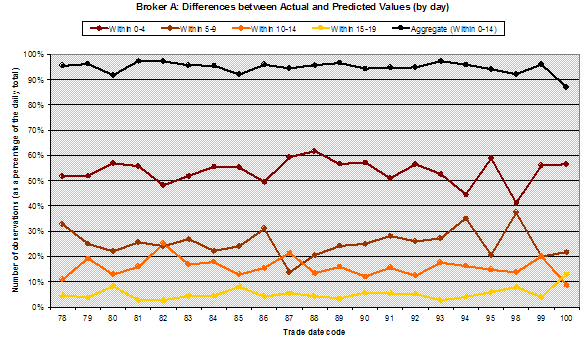
Table 2 – Analysis of the 21 price movement band tests for Broker B (21 trading days in December 2004)
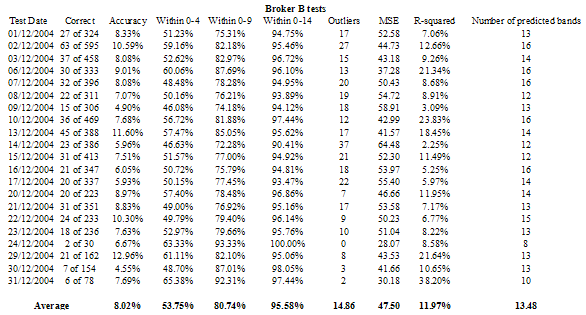
Chart 2 – Differences for Broker B between actual and predicted price movement bands – out of 20 bands – yellow line shows the % of ‘outliers’, trades where the difference is 15 or more
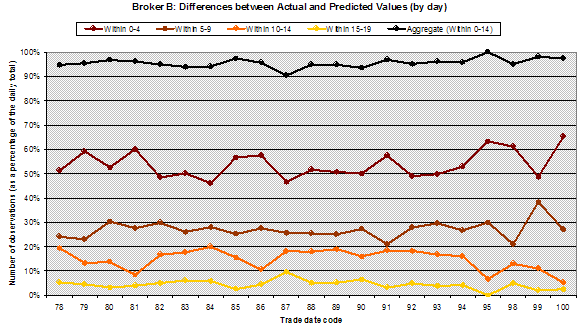
Table 3 – Analysis of the 21 price movement band tests for Broker C (21 trading days in December 2004)
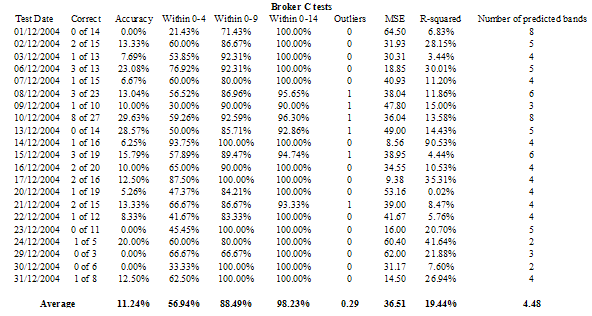
Chart 3 – Differences for Broker C between actual and predicted price movement bands – out of 20 bands – yellow line shows the % of ‘outliers’, trades where the difference is 15 or more
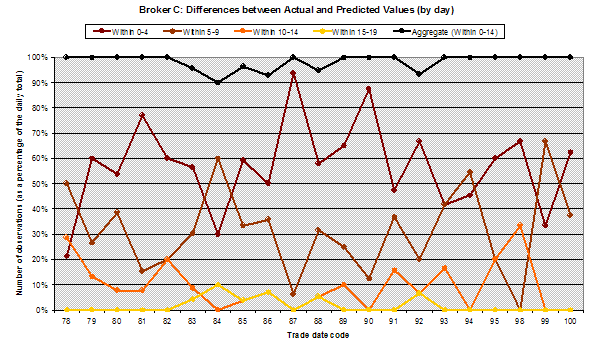
Table 4 – Analysis of the 21 price movement band tests for Broker D (21 trading days in December 2004)
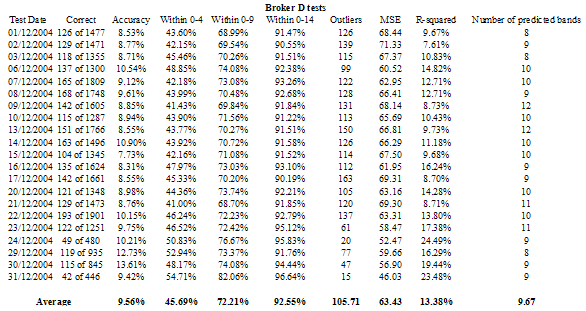
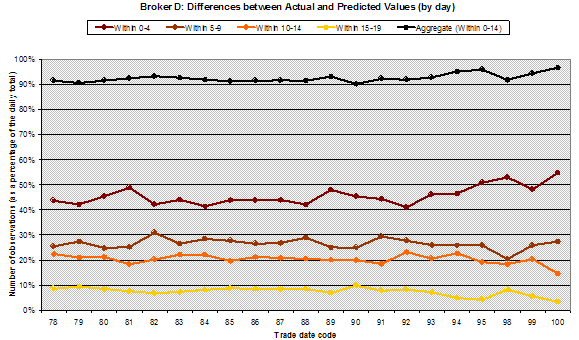
Chart 4 – Differences for Broker D between actual and predicted price movement bands – out of 20 bands – yellow line shows the % of ‘outliers’, trades where the difference is 15 or more
The team was keen to establish that these results were better than those of a “naïve classifier” and conducted Liddell’s test for paired proportions. Again, the predictions made for Broker’s A, B and D are significantly better than those that would be made by a naïve classifier. The evidence for Broker C (a much smaller dataset) was weaker, but still supported the performance of the SVM. The team also put in a handful of ‘wacky’ trades, i.e. trades where the variables were copied from real trades, but the actual price movements were artificially exaggerated or muted. The SVM correctly identified four out of the five as anomalous.
Filtering Outliers
An outlier, or anomalous trade, was defined as a trade where the predicted price movement differs from the actual price movement by more than 15 bands out of 20 – either a very high price movement was predicted but a low price movement was observed, or a very low price movement was predicted but a high price movement was observed.
Table 5 – An analysis of outliers by broker
| Broker | Number of December trades | Number of outliers | % outliers | Number of trades outside bid/offer | % outside bid/offer | Outliers outside bid/offer | % outliers outside bid/offer |
|---|---|---|---|---|---|---|---|
| First Filter | First Filter | Second Filter | Second Filter | Combined Filters | Combined Filters | ||
| A | 2,232 | 109 | 4.88% | 56 | 2.51% | 1 | 0.04% |
| B | 6,530 | 312 | 4.78% | 2,879 | 44.09% | 124 | 1.90% |
| C | 294 | 6 | 2.04% | 11 | 3.74% | 1 | 0.34% |
| D | 28,623 | 2,220 | 7.76% | 2,621 | 9.16% | 277 | 0.97% |
| Overall | 37,679 | 2,647 | 7.03% | 5,567 | 14.77% | 403 | 1.07% |
Table 5 indicates that when using the SVM as a filter [First Filter] on average 7% of non-SETS trades are defined as outliers. 7% is still too many outliers for a detailed manual investigation. A second filter is therefore needed. A trade is unlikely to fail best execution if it was conducted at the best prevailing price (or better), though there are some arguments that very large trades might be capable of exceptional improvement under certain conditions. When excluding trades outside the bid/offer spread [Second Filter] is combined with the first filter the number of outliers that are outside the bid/offer spread is approximately 1%.
In order to further verify the results shown in Tables 1 to 4, the team analysed the quality of predictions within the ‘extreme’ bands [Table 6]. These are the three bands with the lowest price movement (0, 1 and 2) and the three with the highest price movements (17, 18 and 19).
Table 6 – An analysis of outliers from the extreme bands – 3 lowest and 3 highest bands
| Actual Band | Correct | Within 0-4 | Within 5-9 | Within 10-14 | Outliers | Total | |
|---|---|---|---|---|---|---|---|
|
Low Price Movements |
0 | 1,034 | 1,143 | 84 | 84 | 712 | 2,023 |
| 1 | 59 | 867 | 74 | 202 | 415 | 1,558 | |
| 2 | 18 | 1,041 | 72 | 612 | 83 | 1,808 | |
|
High Price Movements |
17 | 448 | 1,510 | 1,510 | 56 | 247 | 1,841 |
| 18 | 226 | 1,343 | 30 | 26 | 181 | 1,580 | |
| 19 | 588 | 1,473 | 34 | 8 | 88 | 1,603 | |
| Overall | 2,373 | 7,377 | 322 | 988 | 1,726 | 10,413 | |
| % | 22.8% | 70.8% | 3.1% | 9.5% | 16.6% | 100% |
It can be seen from this table that 22.8% of predictions within the six extreme bands were correct and 70.8% were within 4 bands. Only 16.6% of predictions from these bands were defined as outliers.
There was no outstanding single feature about the trades that were identified as outliers. The team wanted to assess how the outliers identified by the SVM method differed from outliers identified by the two most common methods in use at present, comparison with VWAP and comparison with current market price. An inspection of the list of outliers showed very little cross-over with either of these methods.
The average VWAP movement of the 2,647 SVM outliers is 0.28%. The average VWAP movement of the 2,647 trades with the highest VWAP movement is 4.68% - nearly 17 times higher. In a random nine day sample of trades, the SVM outliers are plotted against 10 bands of increasing VWAP movement [Table 7], there is no significant correlation:
Table 7 – An analysis of SVM outliers by band of increasing VWAP
| Bands of increasing VWAP | 1 | 2 | 3 | 4 | 5 | 6 | 7 | 8 | 9 | 10 |
|---|---|---|---|---|---|---|---|---|---|---|
| Percentage of SVM outliers | 13% | 6% | 8% | 6% | 7% | 10% | 13% | 10% | 23% | 4% |
The average distance from best market price of the 2,647 trades with the highest distance is 18.75% - nearly 3.5 times higher. If the SVM outliers are plotted against distance from best market price, there is again no significant correlation [Table 8].
Table 8 – An analysis of SVM outliers by band of increasing distance from best price
| Bands of increasing distance from best price | 1 | 2 | 3 | 4 | 5 | 6 | 7 | 8 | 9 | 10 |
|---|---|---|---|---|---|---|---|---|---|---|
| Percentage of SVM outliers | 8% | 9% | 11% | 8% | 17% | 12% | 11% | 8% | 9% | 6% |
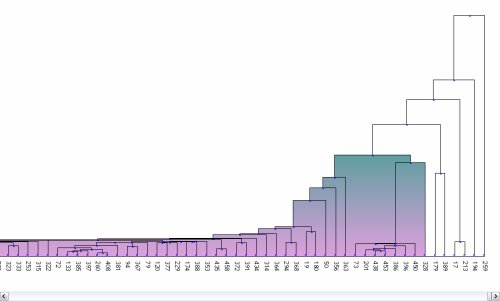
The team also briefly compared the SVM outliers with a set of outliers produced by single-link hierarchical clustering. A random sample of trades was clustered and the outliers identified. The result of this clustering is shown in Diagram 4. The most similar trades are linked by a horizontal line towards the bottom of the vertical axis (and left on the horizontal axis). Trades linked higher up (and further right) are less similar to one another. None of the outliers corresponded with the SVM outliers from the same dataset, however, the team intends to conduct further research in this area.
Diagram 4 – Clustering of trades with the most similar trades linked at the bottom and the ‘outliers’ at the far right of the diagram.
One question that was raised during the research was how well did the SVM perform for trades in a single share. Several shares with a reasonable number of trades were examined. The overall level of outlier prediction and distribution of differences between actual and predicted price movement band is very similar to datasets over all shares [Chart 6].
Chart 6 – The difference of actual and predicted price movement band movement for a single share plotted against current share price
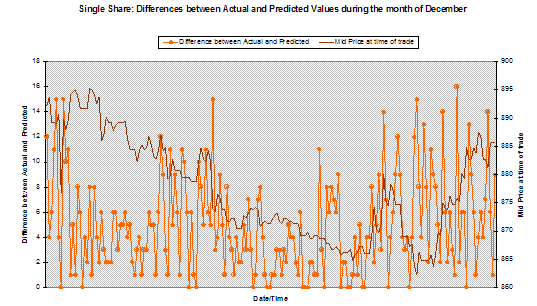
Chart 6 demonstrates that during a time of rapid change in market prices it appears that the SVM does seem to note turning points between trend and uncertain, and uncertain and trend.
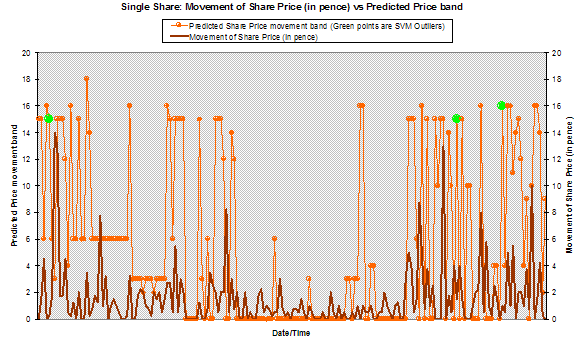
The team also examined how well the SVM could predict the magnitude of a single share’s price movement [Chart 7]. By plotting the actual share price movement since the last trade against the SVM predicted price movement band it is evident that the SVM does achieve reasonable predictions of price movement and ultimately responds well to changes in the market. The three outliers for this frequently traded share are plotted in green. It is interesting to note that in all three cases the SVM presages major changes, but for this broker they hadn’t occurred at that point. The team would recommend further research in this area.
Chart 7 – Movement of share price (in pence) and predicted price movement band for a single share
Another aspect of the results which interested the team was the rate of decay of accuracy over time as it would determine how often a predictive model would need to be rebuilt for any installation of an automated compliance system. The majority of the tests conducted were making predictions for the next full day. It is noticeable that predictions for the afternoon are less accurate than those for the morning. Tests were conducted using half-day model rebuilds (as opposed to whole day). Accuracy did improve marginally using half-day tests. Then tests were conducted using one and two hour time slots. Hourly and two-hourly tests proved not to be significantly more accurate than the half day tests. It would appear from the limited amount of testing done in this area that a half-day rebuild would be sufficient, but the team recommend further testing on rebuild intervals.
Usefulness of Results
Participant Assessment
The team discussed the outliers or anomalous trades with the brokers in order to assess their reaction to the trades that were identified. Some of the remarks made were:
- “This system highlighted anomalous trades and if we had been using it, we would certainly have investigated any of these trades that were outside the Bid/Offer spread”.
- “This system would be a great way of seeing a small number of ‘odd looking’ trades that we could check - the fact that the same principles could be applied to fixed income and other instruments makes it particularly interesting”.
- “An extremely interesting and innovative approach – the trades that were highlighted would certainly have been investigated. Whist there was no real pattern or similarity in the outliers they were all things that should have been looked at”.
Of the trades that were highlighted as anomalous and outside the spread, a compliance officer said “one was a proprietary trade, but it is very interesting that it was picked up”. Another was part of a convertible bond swap and the compliance officer said “this one would definitely have warranted investigation at the time”.
- “I was fascinated to see the selection of trades that this system identified – there were good reasons why all of them traded at the prices shown but they were just the sort of trades that we should have been looking at”.
- “Several of the trades you picked up on were ‘in-house’ trades – typically closing out short-term positions. Although they were interesting because of the price, we would probably want to filter out most of them before investigating the rest”.
- “Seems like a very sensible approach and the trades it has identified would certainly be the ones our compliance people would want to look at”.
- “The prototype workstation, with all the information about each trade and the drill down functionality is just the sort of tool we would use”.
However, it is clear that the participant reactions so far are based on quick inspection, not statistical analysis. There does appear to be a need for an agreed set of ‘test trades’ incorporation normal and anomalous trades so that any system could use the test set for calibration and validation, i.e. does it spot trades which industry insiders would agree are anomalous.
How Could A SVM/DAPR Approach Be Used In Practice?
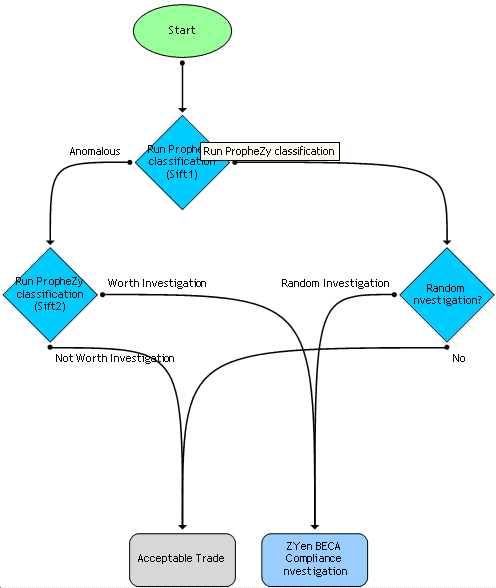
In practice the SVM/DAPR approach would probably be combined with a workflow management system which could be integrated with the visualisation and drill down tools shown in Diagrams 1 and 2. Initially the SVM/DAPR filter for outliers and the second filter for trades outside the bid/offer spread would be used to sift the anomalous trades from the regular ones. These trades would be combined with a small number of randomly selected trades as a control to produce a set of trades worthy of investigation [Diagram 5].
Diagram 5 – Possible workflow management tool – Part 1 - Identifying trades for investigation
The trades that are to be investigated could be referred to the trader for explanation – do client instructions, market conditions, the size of the trade or any other factors explain the the execution price? [Diagram 6]. This type of system would allow brokers to track the investigation process and provide an ‘audit trail’ of compliance officers’ work.
Diagram 6 – Possible workflow management tool – Part 2 – Investigation process
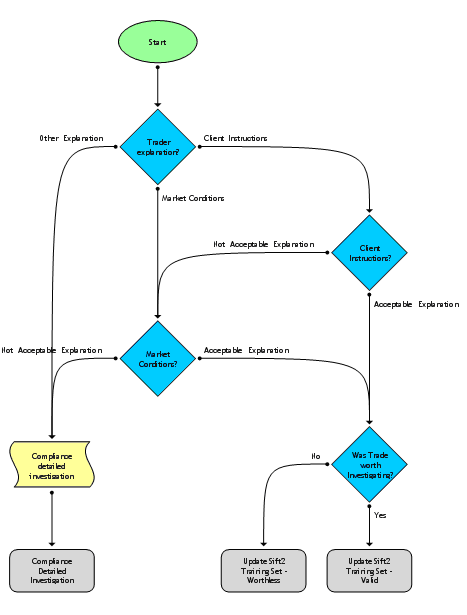
While this process might well be an adequate process, it might be improved by incorporating the results of investigations. For example, as these anomalous trades were investigated, over time a second sift could be constructed by building a second SVM/DAPR tool. This second sift would ‘learn’ from the compliance team’s investigations whether some suspicious trades were actually not worth investigation.
This research shows that dynamic anomaly and pattern response systems based on support vector machines appear capable of identifying trading anomalies at reasonable cost within usable timeframes. The choice for the wholesale financial industry is whether to move forward with SVM/DAPR as a proportionate automated response or to resist attempts to prove that trades are well executed.
References
- Boser, B., Guyon, I. and Vapnik, V., “A Training Algorithm for Optimal Margin Classifiers”, in Fifth Annual Workshop on Computational Learning Theory (COLT-92), pages 144-152, Pittsburgh, ACM (1992).
- Burbidge, Robert and Buxton, Bernard, “An Introduction to Support Vector Machines for Data Mining”, Keynote YOR 12 (Young Operational Research 11th Conference, University of Nottingham, 28 March 2001), Computer Science Department, University College London, Gower Street, WC1E 6BT, UK - www.orsoc.org.uk/conf/previous/yor12/Keynote%20-%20Robert%20Burbidge.doc.
- Cao, L.J. and Tay, F.E.H., “Support Vector Machine With Adaptive Parameters In Financial Time Series Forecasting”, IEEE Transactions on Neural Networks, Volume 14, Issue 6, pages 1506-1518 (November 2003).
- Cao L.J. and Tay F.E.H., “Financial Forecasting Using Support Vector Machines”, Neural Computing Applications, Volume 10, Number 2, pages 184–92, Springer-Verlag (May 2001).
- Cristianini N. and Shawe-Taylor J., An Introduction To Support Vector Machines And Other Kernel-Based Learning Methods, Cambridge University Press, 2000.
- Huang, W., Nakamori, Y. and Wang, S.Y., “Forecasting Stock Market Movement Direction With Support Vector Machine”, Computers and Operations Research, Volume 32, Number 10, pages 2513-2522, Elsevier (2005).
- Liddell, FDK, “Simplified Exact Analysis Of Case-Referent Studies; Matched Pairs; Dichotomous Exposure”, Journal of Epidemiology and Community Health, Volume 37, Number 1, pages 82-84 (March 1983).
- Mainelli, Michael, “Competitive Compliance: Manage and Automate, or Die”, Journal of Risk Finance, The Michael Mainelli Column, Volume 6, Number 3, pages 280-284, Emerald Group Publishing Limited (June 2005).
- Mainelli, Michael, “Finance Looking Fine, Looking DAPR: The Importance of Dynamic Anomaly and Pattern Response”, Balance Sheet, The Michael Mainelli Column, Volume 12, Number 5, pages 56-59, Emerald Group Publishing Limited (October 2004).
- Mainelli, Michael, Harris, Ian and Helmore-Simpson, Alan, “The Auditor’s Cross Subsidy” (statistical modelling of audit prices), Strategic Planning Society E-Newsletter, Article 1 (June 2003). Also published as “Anti-dumping Measures & Inflation Accounting: Calculating the Non-Audit Subsidy”, www.mondaq.com (19 June 2003).
- Meyer, David, Leisch, Friedrich and Hornik, Kurt, “Benchmarking Support Vector Machines”, Adaptive Information Systems and Modelling in Economics and Management Science Report Series, Number 78, Vienna University of Economics and Business Administration (November 2002).
- Michie, D., Speigelhalter, D.J. and Taylor, C.C., Machine Learning, Neural and Statistical Classification, Ellis Horwood (1994), out of print – see www.amsta.leeds.ac.uk/~charles/statlog/.
- Vapnik, Vladimir N., Statistical Learning Theory, John Wiley & Sons (1998).
- Vapnik, Vladimir N., The Nature of Statistical Learning Theory, Springer-Verlag, New York (1995).
Thanks
Michael and Mark would like to thank Alan Helmore-Simpson, the project manager of PropheZy development, and John Murray and Tim Scarfe, the project managers of VizZy development, for all of their assistance. Michael and Mark would also like to thank Christopher Hall, Ian Harris and Simon McClean for their quality assurance advice during the project, as well as Jeremy Horne for tremendous amounts of data processing.
Michael and Mark would like to thank Gervase Clifton-Bligh of Fractal Edge and Freddie McMahon of Decisionality for the use of their software in demonstrating how a compliance workstation might work.
Michael and Mark would like to thank the participants in this research without whose data this study would not have been possible. Finally, we would like to thank our sponsors, Sun Microsystems (with a special mention to the ever-supportive Nigel Woodward) and the London Stock Exchange (with a special mention to the ever-helpful Gurbindar Bansal) for their support.
Professor Michael Mainelli, PhD FCCA FCMC MBCS CITP MSI, originally did aerospace and computing research followed by seven years as a partner in a large international accountancy practice before a spell as Corporate Development Director of Europe’s largest R&D organisation, the UK’s Defence Evaluation and Research Agency, and becoming a director of Z/Yen (Michael_Mainelli@zyen.com). Michael was awarded IT Director of the Year 2004/2005 by the British Computer Society for Z/Yen’s work on PropheZy. Michael is Mercers’ School Memorial Professor of Commerce at Gresham College (www.gresham.ac.uk).
Mark Yeandle, MBA BA MCIM MBIM, originally worked in consumer goods marketing and held senior marketing positions at companies including Liberty and Mulberry. His experience includes launching new brands, company acquisitions & disposals and major change management programmes. Mark has been involved in many of Z/Yen’s recent research projects including a resourcing study, an anti-money laundering research project, and an evaluation of competitive stock exchange systems. Mark has also been closely involved with the testing and use of PropheZy in marketing applications.
Z/Yen Limited is the UK’s leading risk/reward management firm, helping organisations make better choices. Within Financial Services Z/Yen performs benchmarking and performance analysis, market surveys, strategic planning, market intelligence, change management and project management. Z/Yen’s benchmarking work encompasses European securities, US securities, global derivatives processing, global foreign exchange and money markets, clearance and settlement and operational performance. Z/Yen’s operational improvement work covers systems, people and organisation. Z/Yen received a Foresight Challenge Award in 1997 for its work on the £1.9million Financial £aboratory researching the visualisation of financial risk and a DTI Smart Award 2003 for the risk/reward prediction engine, PropheZy. For more information see www.zyen.com.