An Investment Portfolio View Of The Low Carbon World
By
Professor Michael Mainelli, James Palmer, Liang Shi
Published by Investment Opportunities For A Low Carbon World, Chapter 24, Will Oulton (ed), GMB Publishing (2009), pages 281-299.
A Portfolio Approach To Climate Change Investment And Policy
During 2007, the London Accord, like other climate change investigations, concluded that there is no single solution to the problem of climate change. One thematic paper drawing the London Accord results together was "A Portfolio Approach To Climate Change Investment And Policy" by Michael Mainelli and James Palmer [Mainelli and Palmer, 2007]. Mankind must deploy a diverse range of potential solutions - market solutions, technological solutions and social solutions.
The ‘supply side’ of potential solutions does not contain one guaranteed single solution, a ‘silver bullet’. Pacala and Socolow [2004] note, "Although no element is a credible candidate for doing the entire job (or even half the job) by itself, the portfolio as a whole is large enough that not every element has to be used." On the ‘demand side’, Stern [2006] highlighted the limitations of cost/benefit analysis where one cannot afford to fail; cost/benefit analysis is of little use in Russian roulette unless you accept extinction as an option. A portfolio approach to climate change solutions is warranted given the catastrophic nature of failure – "don’t put all your eggs in one basket".
Policy is important to portfolio selection; more so is investment. According to the United Nations Framework Convention on Climate Change (UNFCCC), "When considering the means to enhance financial and investment flows to address climate change in the future, it is important to focus on the role of private-sector investments as they constitute the largest share of investment and financial flows (86%)." [UNFCCC, 2007] However, the UNFCCC does not say how that private sector investment will happen (there were attempts, but private sector consultations met with disappointingly little enthusiasm). Both Stern and UNFCCC worked top-down, macro-economically.
Investors realise that there is rarely a single winner in any investment field, "there will be winners and losers". There is a continuum from portfolio investment to direct project investment where somewhere along the continuum things change from picking a portfolio to picking and supporting a potential winner. Still, long-term investment is about having a range of options. Investors analyse a range of options as a portfolio. For the majority of investors, the ‘most effective’ portfolio means the most profitable selection of options for a given level of investment and financial risk. Similarly for policy-makers, ‘most effective’ is likely to mean a portfolio that delivers a desired level of emissions reduction for the lowest cost and level of social risk. Any single solution may fail or, at the extreme, even increase climate change. But policy-makers have a strong tendency to try and pick winners.
Some shared assumptions among The London Accord participants are:
- climate change is one of the world’s great externalities;
- green house gas emissions (GHG) can be internalized through a price mechanism, a cap-and-trade system, a carbon tax or, perhaps realistically, a hybrid cap-and-trade system with auctioned permits;
- the world is looking at its greatest infrastructure transformation;
- private sector investment is not just important to solving climate change, it is essential;
- investors only invest significantly when they can make returns commensurate with risk;
- there will be significant winners and losers;
- policy-makers need to avoid trying to guess the winners, but rather develop technology and solution neutral market prices within which investors and market participants can select winners;
- long-term investors, e.g. pension funds and larger fund managers, need to take a portfolio approach.
Diagram 1 sets out a simplified model of the London Accord perspective on the systems involved in investment and climate change.
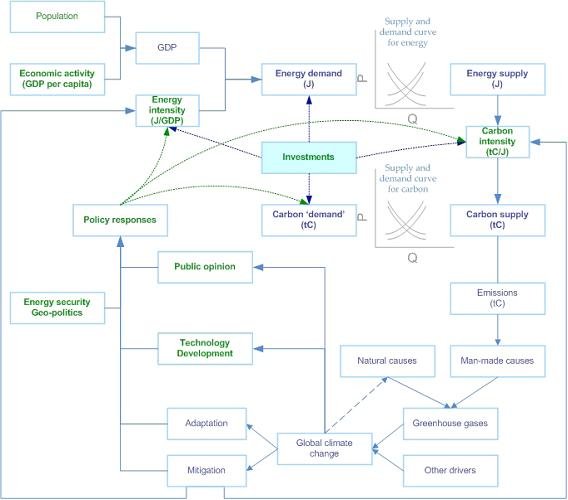
At the core of the diagram are the supply and demand models which stand for the market and policy mechanisms that set prices for energy and for GHG emissions. Given the wide range of investment options, sensitive to dynamic factors such as energy prices, carbon prices, policies, standards, regulation, taxation, and rates of technology improvement, larger investors with longer-term views participating in the London Accord, e.g. investment managers, asset managers and pension funds, sought a top-down Monte Carlo analysis of possible climate change portfolios, a Portfolio Model. Such a Portfolio Model could answer some key questions, not least of which were:
- Can existing investment opportunities solve climate change?
- Are there significant gaps or dependencies in reasonable investment portfolios?
- Where would further investment research have the most impact?
Intergovernmental Panel on Climate Change (IPCC) data and London Accord information, in conjunction with a number of ‘heroic’ assumptions, can produce an outline Portfolio Model as a starting point for further thinking by investors and climate change policy-makers. A bottom-up Portfolio Model differs from much of the IPCC or Stern Report macro-economic approaches by (1) being closer to how investors often model their choices, and (2) examining multiple end-points efficiently. A Portfolio Model on climate change investments can be neither comprehensive nor rigorous at the present time. The data needed for a comprehensive model is not available. There is no consensus view on many important factors. Investors and policy-makers have differing assumptions and opinions about risks, returns, technological improvement, market elasticity, factor interactions, and likely scenarios, just to get started. Still, a starter Portfolio Model can at least start to map out the likely risks and returns and begin to answer the three questions above.
Modern Portfolio Theory (MPT)
Harry Markowitz proposed Modern Portfolio Theory (MPT) in 1952, later sharing a Nobel Prize with Merton Miller and William Sharpe for founding a school of thought on the rational selection of investment portfolios. Before MPT, investors assessed the risks and rewards of securities individually with little thought for the overall risk or reward in their portfolios. It was assumed that the best portfolio consisted of the amalgamation of securities with the most opportunity for gain at the least risk. An investor might invest solely in automobile companies because all automobile companies’ securities seem to offer better risk/reward than all other industries’ securities. In the extreme, an investor might invest solely in the ‘best’ automobile company, to the exclusion of all other securities. Overall portfolio risk and reward might be ignored. Post MPT, such an approach would be considered crude or even dangerous. Markowitz set out the mathematics behind diversification, recommending that investors select portfolios based on their overall risk/reward characteristics. Investors should select for their portfolios, not just pick individual securities. And they should select portfolios along the "efficient frontier". From Wikipedia: "… for a given amount of risk, the portfolio lying on the efficient frontier represents the combination offering the best possible return. Mathematically the Efficient Frontier is the intersection of the Set of Portfolios with Minimum Variance and the Set of Portfolios with Maximum Return…"
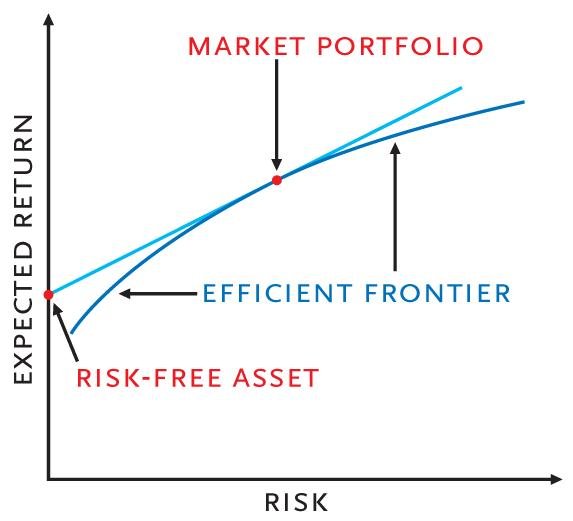
Specific risk is the risk associated with individual options. Within a diversified portfolio overall specific risk starts to cancel out. From the universe of possible portfolios, certain ones will balance risk and reward better than others. James Tobin developed the idea of the "risk-free asset" permitting the selection of the super-efficient portfolio and introducing the use of leverage. Sharpe developed the capital asset pricing model (CAPM), introducing beta as a measure of asset or portfolio expected risk against the market. Sharpe pointed out that the overall market portfolio should intersect the efficient frontier at Tobin’s super-efficient portfolio. According to CAPM, investors should mimic the market portfolio, leveraged or de-leveraged with positions in the risk-free asset.
MPT gave a context for understanding systematic risk and reward, led to structured management of institutional portfolios and inspired passive, ‘tracker’, investment management approaches. Naturally, MPT has been followed by a ‘Post-Modern’ Portfolio Theory which tries to model more closely a real world situation where the underlying distributions are non-normal, risks and rewards are non-linear, and where human behaviour matters. In summary, the basic concepts of MPT are diversification, the efficient frontier and the capital asset pricing model.
Methodology
The efficient frontier of a Portfolio Model should produce sensible combinations of climate change solutions for further discussion. The model should produce combinations across a range of expenditures and returns. In the case of climate change expenditure, financial returns are not sufficient, the model should also produce returns as a range of greenhouse gas emission reductions (abatement). A Monte-Carlo approach can used to generate possible portfolios using an algorithm outlined in Diagram 3:
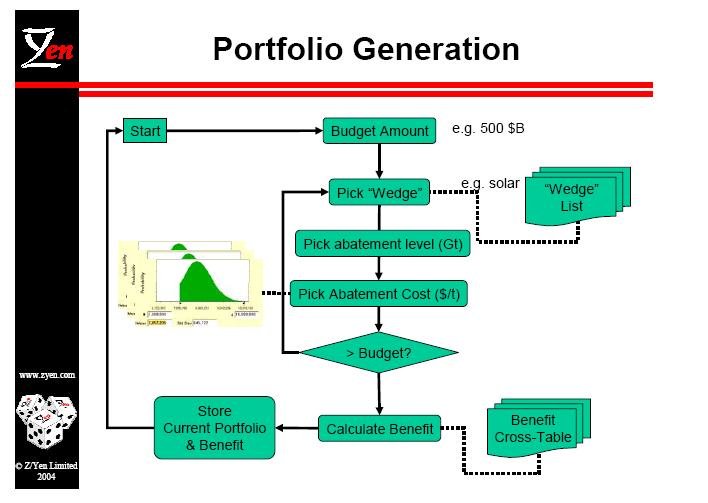
There are two loops in this algorithm. The outer loop is the "budgetary loop". In each budgetary loop the algorithm randomly generates an annual budget up to $850 billion/year (by way of comparison, about 2% of global GDP). Within the inner loop, the "wedge loop", the algorithm randomly selects an investment option (equivalent to a "wedge", e.g. "Nuclear", "Hydro", Pacala and Socolow (2004)), and then selects a random abatement level for the wedge up to the maximum potential of the corresponding technology. The next step generates an abatement cost from the assigned cost distribution. The inner loop ends when the allocated budget is reached, generating one portfolio. The outer loop runs up to the number of portfolios desired for analysis, e.g. ten thousand.
Data
The key input data are returns and costs. Returns are investment returns or greenhouse gas emission reductions. The primary source of data was the 2007 IPCC Working Group III Report "Mitigation of Climate Change" and London Accord data. The abatement costs are forecast 2030 incremental costs above the cost of capital for an assumed business-as-usual scenario. For example, geothermal costs represent geothermal power infrastructure being built and operated instead of the reference mix of fossil-fuel fired power. The costs are based on replacing existing infrastructure at the end of its normal economic life, not earlier, which limits the potential of new energy infrastructure.
Abatement by portfolio - The basic portfolio variables consist of an input cost, an incremental investment above business-as-usual, and a benefit of annual GHG emissions abatement. In short:
- input = annual incremental cost above cost of capital, in 2030 (in 2006 US$);
- value = annual 2030 GHG emissions abatement (Gt).
Returns by Portfolio - A crude investment ‘return’ was derived by calculating the incremental income that would be generated from a carbon market with a CO2 price ranging between $30/tonne and $40/tonne. This price range reflects a general consensus amongst participants in the London Accord of a realistic social and investment price level for mitigation. In the event, $30/tonne to $40/tonne also tended to be close to the point such that half of the portfolios were profitable and half were unprofitable. The return was calculated as the carbon value for each portfolio’s abatement level as:
- input = annual incremental cost above cost of capital, in 2030 (in 2006 US$);
- value = annual carbon market returns in a $30/tonne to $40/tonne carbon market randomly selected (in 2006 US$).
By the standards of some portfolio models, the Portfolio Model developed for the London Accord is simplistic, but it does illustrate the range of revenue that investors might achieve from technological options combined with carbon markets. Ideally, net investment returns would have been constructed from direct investments, rather than marginal, and contrasted with abatement value for each portfolio, taking into account 25 or more years of risk. The capital requirement, cashflows, discount rates, capital structure, long-term free risk rate and other risk factors will complicate future investment decisions, but this simple portfolio approach still provides a broad overview.
The Base Case
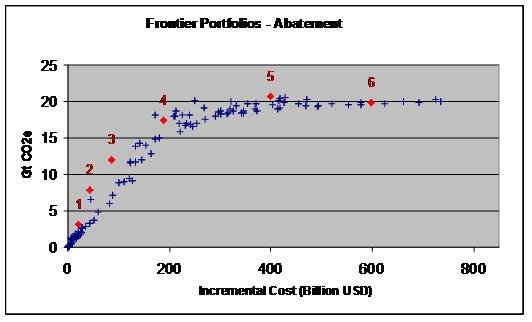
The following charts show the unfiltered portfolio distributions for the base case scenario. The abatement charts plot each portfolio’s emissions reduction against the incremental cost of the portfolio. The radial lines on the abatement charts indicate an average cost of abatement for portfolios on those lines.
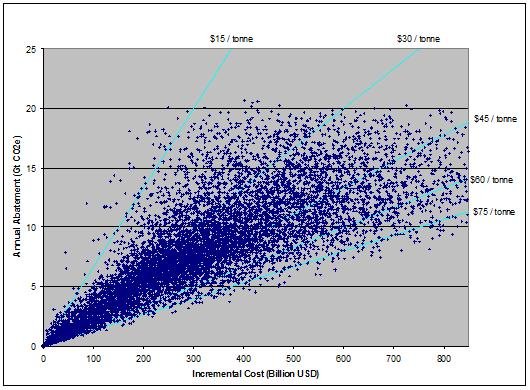
By inspection, Diagram 4, shows that there are numerous potential portfolios that can achieve abatement up to about 15Gt between the $30/tonne and $40/tonne radial lines. When interpreting these graphs it is important to remember that the distributions model the range of possibilities. For example, the chart above suggests that it is possible to construct a portfolio that that might offset 20 Gt CO2e per year for less than $15/tonne, and a bit more likely from $15/tonne to $30/tonne, though a range of $30/tonne to $45/tonne is even more likely. The next chart illustrates the incremental revenue that could be generated for each portfolio in a world of $30 to $40/tonne CO2e avoided.
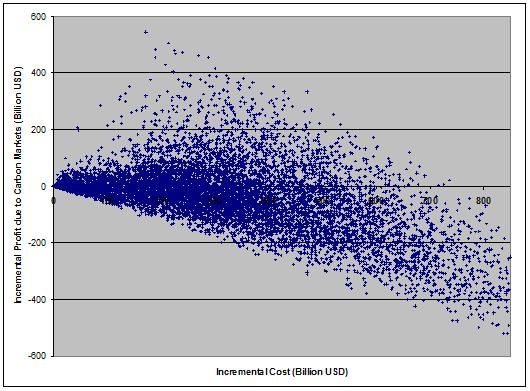
As noted earlier, a $30/tonne to $40/tonne price range for carbon seems to produce a balance of successful investment portfolios and unsuccessful investment portfolios. The portfolio distributions show a wide range of average abatement costs, indicating both uncertainty and the fact that it is possible to construct very bad portfolios. The large proportion of portfolios with negative incremental profits shows that it is rather easy to construct losing portfolios. The wide range of returns, many at significant cost, highlights the perils of policy-makers trying to pick winners rather than allowing markets to learn and ‘evolve’ towards efficient investment.
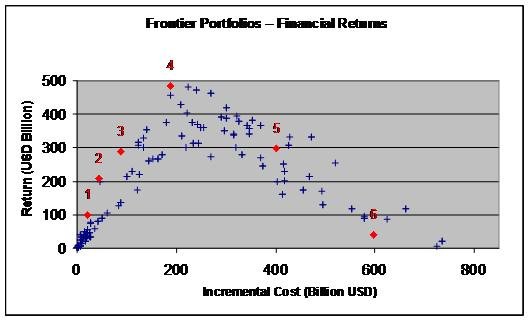
The efficient frontier for the base case touches $15/tonne, potentially indicating that estimates of marginal abatement costs could be on the high side, or more likely, there is a lot of money to be made by selecting an efficient portfolio given current uncertainties in the market. Some specific portfolios on the efficient frontier have been selected for further examination. The two charts below identify six portfolios and their placement on the efficient abatement frontier and on the efficient financial return frontier at prices of $30/tonne to $40/tonne of CO2e.
Interestingly, Stern [2006, page 211] estimates 1% of global GDP as the likely cost to avoid climate change, in a range from -1% to +3.5% of global GDP at estimates of global GDP from $35 trillion to $45 trillion. Diagram 7 below, where rates of return begin to decline after about $300 billion of incremental expenditure but abatement portfolios are in the 10Gt to 20Gt range, is in line with the Stern Report, at least at prices of $30/tonne to $40/tonne of CO2e.
In Diagram 8, each of the six selected portfolios has been broken down by investment option, displayed separately for abatement and cost. For example, in Portfolio 1, nuclear is the biggest contributor to abatement while forestry is the largest contributor to cost.
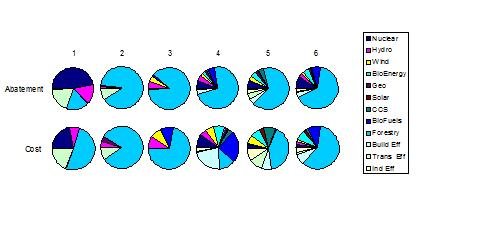
Contrasting just two of the six portfolios, four and five, in the table below helps to illustrate how abatement and investment do not necessarily align:
| Portfolio | Cost | Abatement | Returns | Largest Financial Components | Implied Return | Abatement Efficiency |
|---|---|---|---|---|---|---|
| 4 | $200bn | 17.5 Gt | $500bn | biofuels/building efficiency | 250% | $11/tonne |
| 5 | $400bn | 21.0 Gt | $300bn | forestry | -25% | $19/tonne |
The problem is that ‘dream portfolios’, such as Portfolio 4, are possible, but perhaps not probable. First, a large number of things must go right at once. Second, almost all of the dream portfolios rely on fantastic forestry investments for their superb returns. It can be seen by inspection that:
- forestry is by far the most significant contributor to significant portfolios, essentially because (although more uncertain than other options) forestry has the largest abatement potential. Clearly, more definitive, perhaps urgent, research into forestry cost and abatement would help to produce better portfolio analysis;
- nuclear is a proportionally big contributor in the smaller, efficient frontier portfolios, reflecting its cost parity with business-as-usual options; however its scale is limited in the IPCC data reflecting the difficulties associated with new nuclear facilities politically, including planning permission and long-term waste disposal risks;
- solar, CCS (carbon capture & sequestration/storage), and geothermal are not big contributors in the frontier examples. IPCC forecasts their technology cost curves. If technology cost curves change, and this might well be the case for solar, then their importance in an efficient climate change portfolio might alter markedly;
- small abatement portfolios of three or four technologies can be financially rewarding, but achieving large emissions reductions requires a wide range of technologies – there is no silver bullet. This portfolio analysis has not taken account of the risk of failing to solve climate change. Arguably, the risk of failure decreases as the range of options in a portfolio increase.
Conflicting Values – Policy Meets Finance
For most investors, the abatement realised from a low-carbon portfolio is less important than the return on investment of that portfolio. For most policy-makers, the investment community must invest in abatement, yet simultaneously create wealth. Investors undervalue externalities, by definition. Policy-makers undervalue investors’ needs to generate returns within macro-economic and micro-economic frameworks. The Portfolio Model sets out a crude dual ‘returns’ approach that can highlight conflicts between abatement value and investment value. This tension may be particularly evident in markets where certain technologies enjoy direct subsidies in addition to a carbon price signal – these technologies are likely to be more attractive in terms of their investment returns than in terms of abatement. What might be best for investors may not result in the best outcome for the environment, and vice versa.
Critique And Extension
Liang Shi [2008] extended the London Accord work and used two portfolio optimization models to analyse climate change investments - a stochastic programming model and a Markowitz model. The prime objective of both models was to simulate policy-makers choosing efficient portfolios to achieve as high a CO2 abatement level as possible at the lowest cost. Risk was measured by the variance of the portfolios in each of the two approaches. The advantage of the stochastic programming based approach is the ability to decide future production and abatement schemes within capacities (decided by the initial investments) while facing different demand and emission limits. The stochastic programming model, like the London Accord Portfolio model, showed the significant contribution in CO2 reduction made of Nuclear and Forestry in low and high abatement respectively.
The Markowitz approach can suggest winning portfolios for policy-makers when targeted abatement levels are given. The advantage of the Markowitz approach is its ability to provide a straightforward view of CO2e abatement methods and relevant costs. Using a Markowitz mean-variance model framework, to achieve a 24Gt annual global abatement of CO2e, the theoretical maximum potential and well above scientific estimates of what is required, the model indicated that US$800 billion was needed. If negative abatement costs were included, then investors profited at abatement levels starting below 3Gt. Two slightly different models were built under two different assumptions: in one that the abatement costs of each technology are independent; in the second that they are correlated. When abatement costs correlated, higher investment costs were needed than under independent abatement costs. In terms of the proportion of abatement of each investment option, Forestry, Nuclear and Biofuel play large roles while Solar contributes little (London Accord C1: Solar Energy 2007 – Eckhard Plinke and Matthias Fawer, Bank Sarasin, believes, contrary to IPCC projections, that Solar could be a major contributor).
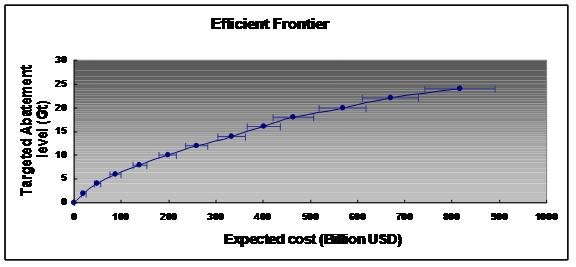
Plotting the optimized expected cost for abating CO2e, excluding negative abatement, against targeted abatement levels up to 24Gt it can be observed in Diagram 9 that 24Gt abatement implies US$820 billion on average, with a variation of about US$70 billion, i.e. US$750 billion to US$890 billion.
Few portfolios can generate significant returns with few "wedges". A strong price mechanism is clearly required to lead to abatement above 3Gt (3Gt is where negative abatement, i.e. obvious wins such as energy efficiency, dissipate). Diagram 10 illustrates the prime abatement investment option for 48 efficient frontier portfolios increasing from 1Gt to 24Gt.
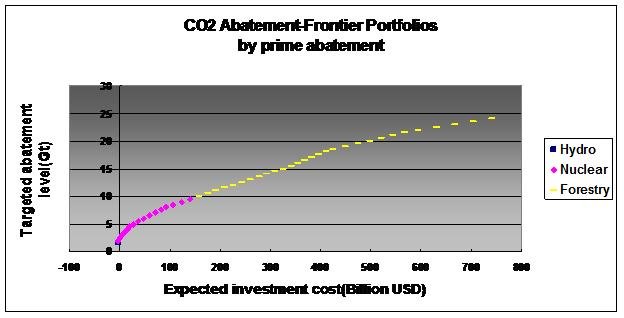
The IPPC report contains two quite different estimates of the abatement potential of forestry, and these affect Diagram 10. The IPCC chose to emphasise their, lower more conservative estimate, but their higher estimate is 13.77Gt. Again, using a Portfolio Model, when the abatement level is less than 10Gt, Nuclear or Hydro dominate, while above 10Gt Forestry is the biggest contributor.
Results
In summary, Portfolio Model analysis indicates that:
- CO2e avoided prices of $30/tonne to $40/tonne seem to produce a reasonable number of portfolios that might lead to abatement up to 20Gt with positive investment returns in about half of the cases;
- significant private-sector investment is possible given enough confidence in a carbon price, probably within a largely cap-and-trade system;
- forestry might be the most significant part of any portfolio, investment or policy. If forestry’s costs and benefits reflect a real opportunity, fantastic, but if they are illusory it is important to dispel that illusion rapidly through research;
- policy-makers should examine some of the reasons for negative abatement opportunities not being seized today, with a view to considering new policies for abatement.
There are a large number of ways in which this Portfolio Model could be improved and extended. The IPCC’s underlying abatement costs are based on relatively low energy prices, approximately $25 to $30/bbl oil. The IPCC points out that an additional cost of $50/bbl for oil is roughly equivalent to a $100/tonne abatement cost. With higher fossil fuel energy prices, renewables and efficiency look much more attractive, whereas forestry and CCS become less attractive abatement options. The Portfolio Model uses abatement costs expressed as costs over and above the use of fossil fuels, but with constant energy price changes and currency market movements all assumptions bear periodic re-examination. Many model extensions would be technical, calculations of discount rates, cashflow estimation approaches, capital structures, asset life estimates, underlying probability distribution work on volatility calculations, as well as significant improvement to the input data. Some obvious improvement areas include:
- aggregate limits: the Portfolio Model ignored the issue of aggregate limits to abatement potential and conflicts between options. For example, if a portfolio contains too much energy efficiency, there will be insufficient demand for new energy sources and lower returns for energy investments;
- each option as a portfolio: the Portfolio Model ignored heterogeneity within investment options, which a richer model might handle as options with sub-options exhibiting their own diversification and concentration effects;
- intra-portfolio correlations: synergies between technologies could be modelled with a multiplicative approach using benefit cross-tables with correlations between different technologies, for example the solar option might be assumed to benefit from the wind option due to joint feed-back-to-grid technology development;
- positive feedback and expectations: expectations on topics as diverse as taxation, political will, elasticity or technology performance curves do affect inputs and returns, and in some way can be self-fulfilling. People observe early failures and invest in previous successes. Further, most investments are made with one eye on the potential for sale to the next investor and then the next. Modelling the evolution of the fitness landscape with positive feedback and expectations would be challenging, but interesting;
- sensitivity: more complete analysis would analyse the response of portfolio models to external variables, testing portfolios for robustness over a wider range of scenarios.
Implications
Both Liang Shi’s 2008 work and the 2007 London Accord work conclude that climate change is preventable using current investment opportunities, but further research would lead to better decisions, particularly research into the abatement potential and costs of forestry. This conclusion may seem a bit ‘rosy’ or optimistic, but the wide many inputs do provide optimism. However, the optimism would become more realistic with more realistic research estimates. As investors learn about what works, and doesn’t, as policy makers learn what policies increase investment and which don’t, portfolios will evolve to more optimal levels.
Savvy investors realise that abatement options are not the only investment response to a changing climate. Adaptation projects or biases towards companies with low carbon exposure are also part of a mix. For savvy policy-makers, there may be a need to incorporate even broader measures of value in the portfolio analysis, beyond just returns and abatement. Forum for the Future’s ‘Five Capitals’ model (see Forum for the Future’s contribution to the London Accord - D3: "Investments To Combat Climate Change: Exploring The Sustainable Solutions") might inform the valuation of portfolios in terms of sustainability.
Portfolio analysis is already an important and powerful tool for investors. Portfolio analysis is not a static tool. Investors must constantly review their assumptions and forecasts. With the addition of an abatement axis, or perhaps additional sustainability axes, multi-value portfolio analysis can help to highlight contradictions between investment potential and policy. Thus, portfolio analysis should be as important a tool for policy-makers as it already is for investors.
Postscript: The London Accord
The London Accord is a unique collaboration among investment banks, research houses, academics and NGOs, providing an ‘open source’ resource for investors, policy-makers, NGOs and politicians interested in environmental, social and governance (ESG) solutions. The London Accord was launched in 2005 by the City of London Corporation, Z/Yen Group, Forum for the Future and Gresham College. In 2006, the London Accord began joint research into climate change. In 2007, when the London Accord published some 24 reports amounting to over 780 pages, its theme was "cash in, carbon out". During 2008, the theme was "making investment work for the climate" and 13 reports were published ranging from efficient buildings to green ICT to ‘peak grain’. The London Accord enters 2009 with 26 contributors, 40 reports and the aim of working "towards better policies through shared investment research". The London Accord continues to seek research on wider sustainability issues such as scarcity of resources, quality of life, governance and health, and hold regular roundtable discussions exploring themes such as investment opportunities in forestry or overcoming barriers to long-term investment – www.london-accord.co.uk.
[An edited version of this article first appeared as "An Investment Portfolio View Of The Low Carbon World", Investment Opportunities For A Low Carbon World, Chapter 24, Will Oulton (ed), GMB Publishing (2009), pages 281-299.]
Further Reading
1. IPCC Fourth Assessment Report - Working Group III Report - "Mitigation of Climate Change" (2007) - http://www.ipcc.ch/ipccreports/ar4-wg3.htm
2. LINTNER, J, "The Valuation of Risk Assets and the Selection of Risky Investments in Stock Portfolios and Capital Budgets", The Review of Economics and Statistics, Volume 47, Number 1 (1965), pages 13-39.
3. MAINELLI, Michael and ONSTWEDDER, Jan Peter (eds), The London Accord: Making Investment Work For The Climate, City of London Corporation (2007) – multiple chapters - http://www.london-accord.co.uk/accord_2007/contents.htm:
Investment Opportunities
C1: Solar Energy 2007 - Eckhard Plinke and Matthias Fawer, Bank Sarasin
C2: Investing in Biofuels - Conor O’Prey, ABN AMRO
C3: Investing in Renewable Energy - Mark Thompson, Canaccord Adams
C4: Energy Efficiency: The Global Case for Efficiency Gains - Miroslav Durana, Tanya Monga and Hervé Prettre, Credit Suisse
C5: Energy Efficiency: The Potential for Selected Investment Opportunities - Asari Efiong, Merrill Lynch
C6: Carbon Capture and Sequestration - Marc Levinson, JPMorgan Chase
C7: Emissions Trading: Trends and Opportunities - Andrew Humphrey and Luciano Diana, Morgan Stanley
C8: Forest Assets for the Future - Stephane Voisin and Mikael Jafs, Cheuvreux
Cross-Analysis
D1: Adaptation: Credit Risk Impacts of a Changing Climate - Christopher Bray, Barclays and Acclimatise
D2: Modelling Carbon Intensity - Valéry Lucas-Leclin, Société Générale
D3: Investments to Combat Climate Change - Exploring the Sustainable Solutions - Alice Chapple, Vedant Walia and Will Dawson, Forum for the Future
D4: Investment in Low-Carbon Technology - the Legal Issues - Lewis McDonald, Herbert Smith, editor
D5: A Portfolio Approach to Climate Change Investment and Policy - James Palmer and Prof Michael Mainelli, Z/Yen
Commentary
E1: Dynamics of Technological Development in the Energy Sector - J Doyne Farmer & Dr Jessika Trancik, The Santa Fe Institute
E2: Toward a Product-Level Standard: Life Cycle Analysis of Greenhouse Gas Emissions - Steven Davis, The Climate Conservancy
E3: A Commentary on the Product-Level Standard - Hendrik Garz: WestLB
E4: Cap-and-Trade Versus Carbon Tax: a Comparison and Synthesis - Michael Mainelli, Alexander Knapp, Z/Yen, Jan-Peter Onstwedder
E5: Carbon Markets: the Forest Dimension - Eric Bettelheim, Gregory Janetos and Jennifer Henman, Sustainable Forestry Management
E6: A Role for Philanthropy - Davida Herzl, NextEarth Foundation
4. MARKOWITZ, Harry M, “Portfolio Selection”, Journal of Finance, Volume 7, Number 1 (1952), pages 77-91.
5. O’CALLAGHAN, Mary, MAINELLI, Michael and HARRIS, Ian, "Maximum Impact", The Charity Finance Journal (July 2004), pages 28-29 - http://www.zyen.com/Knowledge/Articles/maximum_impact.pdf
6. PACALA, S, and SOCOLOW, R, "Stabilization Wedges: Solving the Climate Problem for the Next 50 Years with Current Technologies", Science, Volume 305 (13 August 2004), pages 968-972 - http://carbonsequestration.us/Papers-presentations/htm/Pacala-Socolow-ScienceMag-Aug2004.pdf
7. SHI, Liang, "Portfolio Approaches to Climate Change Investment and Policy", Dissertation Presented for the Degree of MSc in Operational Research with Finance, The University of Edinburgh School of Mathematics (2008).
8. STERN, Nicholas, The Economics of Climate Change: The Stern Review, Cabinet Office - HM Treasury, Cambridge University Press (2006).
9. UNFCCC, "Investment And Financial Flows Relevant To The Development Of Effective And Appropriate International Response To Climate Change" (August 2007).
10. XIA, Yusen, LIU, Baoding, WANG, Shouyang, and LAI, K K, "A Model For Portfolio Selection With Order Of Expected Returns", Computers and Operations Research, Volume 27 (2000), pages 409-422
Thanks
Our thanks go to Dr Andreas Grothey, Dr Julian Hall, Ian Harris, Tessa Marwick, Professor Ken McKinnon, Jan-Peter Onstwedder, Dr Sotirios Sabanis, and Mark Yeandle for all of their comments and assistance.
About the Authors
Professor Michael Mainelli, Z/Yen Group
Professor Michael Mainelli PhD FCCA FSI leads Z/Yen, the City of London’s leading think tank, since co-founding it in 1994 in order to promote societal advance through better finance and technology. Educated at Harvard, Trinity College Dublin and the London School of Economics & Political Science, as a scientist in the 1970’s Michael conceived and delivered the first global environmental mapping project, Geodat, in 1984. Michael became a leading accountancy firm partner in the 1980’s and served on the board of Europe’s largest R&D organisation in the 1990’s. Michael is Professor of Commerce at Gresham College, Visiting Professor at London School of Economics, non-executive Director of the United Kingdom Accreditation Service, Trustee of the International Fund for Animal Welfare and Ocean Alliance, and Principal Advisor to the London Accord.
James Palmer, BP plc
James Palmer was seconded to support the London Accord from BP Australia where he works within BP's Supply and Trading business as an Asset Economist, responsible for the commercial optimisation of BP refineries. Since 1999, James has performed a variety of engineering and commercial roles within BP Refining and BP Integrated Supply and Trading. James holds a BE in Mechanical Engineering from the University of Queensland and studies applied finance.
Liang Shi, University of Edinburgh
Liang Shi studied at Shanghai University (BSc in Mathematics and Applied Mathematics) and The University of Edinburgh (MSc in Operational Research with Finance). Liang obtained prizes in Mathematical Modelling Contests during his undergraduate studies in Shanghai University and a master’s degree with distinction in Edinburgh University. Liang has done significant voluntary work with the Red Cross, museums, middle schools and the 7th China Universities Games. Liang is currently working in Beijing with China Securities Company in the Fixed Income Department.