A Study Of Strategic Practice
By
Michael Mainelli
Published by BDO Consulting (1992), Updated & Re-Issued 2000 & 2005 by Z/Yen Group Limited
1992 by BDO Consulting
Updated and Re-Issued 2000, 2005 by Z/Yen Limited
Michael Mainelli
Z/Yen Limited
5-7 St Helen’s Place
London EC3A 6AU
United Kingdom
+44 207-562-9562 (telephone)
+44 207-628-5751 (facsimile)
email: michael_mainelli@zyen.com
Preface
MANAGEMENT SUMMARY
- Reasons for Survey
- Main Findings
2A. Planning is Popular
2B. No Right Way to Plan
2C. Organisations Feel They Benefit from Planning
2D. Organisations Feel They Should Integrate Plans
2E. Planning Needs Involvement
2F. Few Monitor the Cost of Planning
2G. Conclusion - Approach
- Our Findings
- Survey Work
- Statistical Analysis
- Interviews
- Feedback
- Purpose of Strategic Planning
APPENDIX - Responses to Survey
Preface
“A Study of Strategic Practice” was originally written by Michael Mainelli and published by BDO Consulting in 1992 before further detailed statistical analysis was available in 1994. The research behind “A Study of Strategic Practice” contributed to Michael’s PhD:
Michael Mainelli, “Development of a Risk/Reward Meta-Methodology: A Study in Information Systems Concepts and Applications Derived from Problems with Measurement of Strategic Planning Systems Quality”, Dissertation submitted for the award of the degree of Doctor of Philosophy, The London School of Economics and Political Science, May 2004.
The original document was one of the most thorough studies of strategic practice in the United Kingdom, covering 183 organisations. Though the original survey material stands on its own, of particular interest in this re-publication is the statistical analysis failing to show correlations between strategic planning and measures of successful performance.
Despite being one of the most substantive longitudinal studies of strategic practice, looking back over several years and seeing how firms fared up till 1994, the results were not necessarily welcome, as they questioned whether strategic planning was of any use. Later publications, e.g. MINTZBERG, Henry, The Rise and Fall of Strategic Planning, Prentice Hall, 1994, also increasingly questioned whether strategic planning was of use.
This 2000 re-publication by Z/Yen Limited on the internet is due to significant interest by scholars on the development of strategic planning practice and the dearth of proof that strategic planning, in isolation, improves performance.
MANAGEMENT SUMMARY
1. Reason for Survey
Over the last decade [1982 to 1992] we have seen a significant increase in the number of organisations adopting formal planning processes. Managers perceive their environment to be:
- Changing more rapidly than in the past, reducing the lead time they have to respond to critical events;
- More diverse, with the need, for example, to consider global as well as local markets, social as well as business issues;
- More complex, with the need to take additional factors into account such as greater competition and consumer demands.
In short, organisations have to develop more complex responses to change. Building on our extensive work in strategic planning, we initiated this survey to study current views on planning and identify emerging trends. We have focused on the relationship between higher level plans and subsidiary plans. We used IT planning at the subsidiary level as it is a frequently planned functional area more easily defined than others, such as marketing or production.
In formulating the questionnaire and analysing the responses, we recognise that there is a problem with the interpretation of terminology in planning, with different words or phrases meaning different things to different people, for example strategic, tactical, goal, mission, objective or target. It is not possible to resolve these differences in this report, therefore the analysis of the data is based on the terminology as perceived by the respondents.
This report concentrates on the significant results and we have included, as an Appendix, a copy of the survey with the percentage responses.
The research consisted of 27 interviews and a detailed “Strategy Questionnaire” which was completed by 183 organisations of varying sizes from different industry sectors. The respondents were overwhelmingly board members, 74%. We have analysed the responses to examine the different approaches to planning, who is involved in planning and how effective planning is in improving performance.
2. Main Findings
2A. Planning is Popular
84% of the participating organisations are either using or developing strategic plans. 62% of organisations have a formal or informal IT plan. We had anticipated that larger companies and certain sectors would be more likely to plan formally, however the results suggest that planning is not restricted to a particular type of organisation or business sector.
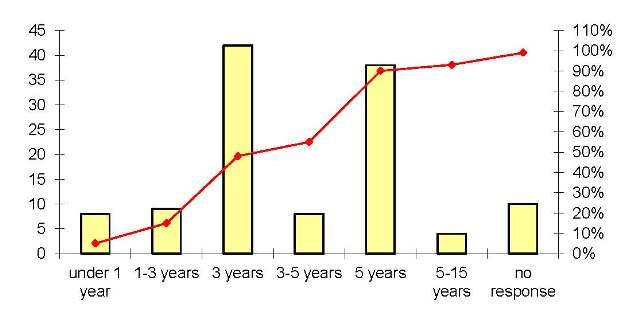
The majority of organisations, 89% had started planning within the last ten years. 67% had started planning within the last 5 years. Once organisations have adopted a formal planning process they seem to continue. No organisation appears to have abandoned strategic planning.
2B. No Right Way to Plan
69% of organisations agreed that strategic planning should predict the future performance of a company. Plans are frequently number based, with both financial and quantified non-financial projections or targets. Organisations place greater emphasis on current and future performance than on historical performance. However there is also the recognition of the need to encourage involvement and of the value of the planning process in promoting changes in corporate culture.
Over 67% of organisations do not follow a philosophy or methodology developed by recognised strategists. However, the majority of organisations use a mission statement, market research and SWOT analysis to develop their plans. Other techniques are used to lesser, and varying degrees.
A planning horizon of 3 or 5 years is popular [interestingly, even numbered years are absolutely not popular – out of 183 organisations, not one mentioned two years or four years]. 63% review the strategy on a yearly basis.
2C. Organisations Feel They Benefit From Planning
93% of organisations believe that strategic planning should improve performance. Of those organisations which have a formal strategic plan only 69% felt it had led to better performance. The main perceived benefits related to setting of specific goals, objectives and key milestones.
2D. Organisations Feel They Should Integrate Plans
Participants feel that functional planning should be integrated with business planning, with 72% agreeing that this could generate improvements in performance. However only 37% of those who had developed an IT plan integrated it with their business strategy.
59% integrate the corporate plan with subsidiary business plans and 41% integrate the corporate plan with the functional plans. Only 24% include corporate, business and functional plans as part of their strategic plan.
2E. Planning Needs Involvement
80% of participants agreed that staff must know their role in the planning process for the plan to be successful. 90% agreed that staff commitment is necessary for a strategic plan to be successful. However, only 24% of organisations involve staff in the preparation of the strategic plan, and only 57% communicate it to them.
There is less director involvement in IT planning than in strategic planning. 30% of participants indicated that user staff were responsible for the IT plan and 65% of IT senior staff. Organisations, 30%, tended to involve their IT suppliers in developing their IT plans of which 20% used preferred suppliers.
2F. Few Monitor the Cost of Planning
Approximately one third of organisations monitor the financial and man day resources used in preparing a strategic plan, a further third measured only the man days resources involved. A third monitored neither. These proportions were repeated for IT planning. It was apparent from the comments received in this section that the figures provided by participants were generally estimates and few organisations actively monitored the effort and effectiveness of their plans.
2G. Conclusion
Strategic planning and IT planning are clearly considered important by the participants but the formal planning process is relatively new for most organisations. No single approach emerged as a popular approach to planning.
Organisations feel that they benefit from planning despite little empirical evidence that planning does improve performance. Although organisations acknowledge the benefit of improving performance by integrating the strategic plan with the IT plan, only a third of organisations actually do so.
Survey Work
A tremdendous amount of work was done to develop, conduct and analyse the survey over 1991 and 1992. The Survey, published by BDO Binder Hamlyn as A Study of Strategic Practice in October 1992, attempted to establish the current state of strategic planning. The Survey questionnaire was designed during 1991. 5,000 firms were mailed the questionnaire in early 1992. The responses were largely received by April 1992. Initial statistical analysis was conducted in April and May 1992. Some 27 interviews, half conducted by the author and half by other employees, were conducted between April and September 1992 as part of verifying the questionnaire notes. By mid-1993, 35 interviews in total were completed. All of the interviews were documented and the specific questionnaire answers formed part of the preparation for the interview. The preliminary results were circulated in October 1992. Further analysis took place in 1993 when the financial performance of the firms was analysed against their Survey responses. A number of parameters of the Survey are worth noting.
The target participants were commercial firms in the United Kingdom. The relationship between strategic planning and performance has not been as closely studied in the United Kingdom as in the United States. For this reason, there exists a significant bias towards United States concerns in much of the strategic planning literature. Commercial firms were target participants because it was felt that strategic planning systems would be more likely to be comparable if the organisations have similar overall objectives. For commercial firms the overall objectives would presumably be organisational survival and shareholder value maximisation. Other performance or financial objectives would also be more comparable between commercial firms, e.g. profit maximisation, growth in turnover, market share. These commercial objectives might contrast with, say, a government organisation, a professional association or a charity. A government organisation might be more concerned with political impact, a professional association with membership opinion, and a charity with a temporary cause.
Commercial firms were also selected because of the ready availability of quantitative financial information. Most quantitative studies relating financial performance to strategic planning in the United States had studied large firms quoted on one of the United States stock exchanges. There are few legal requirements for United States firms that are not listed on stock exchanges to publish audited financial information. Many researchers in the United States have had to use quoted companies in order to obtain accurate financial information. Listed companies can be influenced by a perceived need to appear to have strategic planning. The need to appear to have strategic planning can be due to many pressures, including the need to issue a prospectus, to discuss results with analysts or to issue public statements from the management to shareholders, e.g. an annual review. In one case study, Norweb, the primary impetus for strategic planning was to satisfy outsiders that strategic planning was taking place. Because listed companies are significantly larger than average, there has been a significant bias in quantitative studies towards larger companies. During the period of investigation, 1989 to 1998, the United Kingdom required that all limited companies, regardless of size, were audited and submitted their accounts to Companies House where they were available for public inspection. Several information services firms put this information into computer-readable format and circulate it to subscribers.
One such database on CD-ROM, ICC’s, was used to select the target participants. The financial information for the firms was readily available for the previous five years from the ICC database. In practice, there were four comparable periods given that financial year-ends differ from calendar year-ends. Restricting the study to firms on the ICC database is a small restriction, as the database contains all firms with a turnover in excess of £1 million. The ICC database comprisesdapproximately the 100,000 largest companies from an estimated total of over 1 million companies in the United Kingdom, but, at the time of issue, this resulted in firms with turnover below £1 million being included, i.e. firms with anywhere from 10 to 30 people. The ICC database clearly excludes non-limited entities, e.g. partnerships. The ICC database at that time was incomplete for banking and insurance, although this could have been an advantage as both these sectors are known to be difficult for comparative evaluation with other businesses, e.g. turnover in a bank is subject to significant interpretation, as is profit in an insurance company. The ICC database can differ significantly in time from the date the questionnaire was completed. Companies did not need to file their accounts for up to 10 months after the end of their financial year. Given that the ICC database is issued each month, it can be assumed that a typical organisation’s entry would be 12 months out of date. Cases where the data were more recent were observed, as were cases up to 18 months out of date. It was preferable to do the financial analysis at some considerable period after the Survey. Nine months was the lag chosen.
Another parameter was the size of firm. Surveys had indicated a widespread awareness of strategic planning amongst all managers, irrespective of size of firm. Firms needed to be of significant size to ensure that a strategic planning process, and responsibility for that process, could be readily identified. On the other hand case studies appeared to indicate that the larger the firms the less comparable results were likely to be. Also, for a number of reasons, previous studies appeared to be biased towards the larger firms. A number of different selections were attempted using the ICC database, e.g. firms selected within ranges of turnover, asset value, number of employees, etc. The selections attempted to find a reasonable number of firms to be mailed a questionnaire, e.g. in excess of 2,000.
The firms selected were not meant to be firms known to the researcher. In a few cases the random selection did in fact result in a few firms known to the researcher being included in the selection, and a few, five, included in the final results. It was also decided not to attempt telephone-based interrogation because of the amount of information sought and the bias against immediate interaction with a stranger. Because the selected firms would have had no previous contact, a number of inducements were put forward to encourage participation in the questionnaire. First, prospective participants were told that the results would be circulated to them. Second, prospective participants were told that their individual response would be anonymous. Third, participants were told of the academic basis behind the work and the association with a PhD programme at the London School of Economics and Political Science. Fourth, participants who completed their questionnaires would receive a set of information technology trivia cards as a token of appreciation. 250 sets of cards had been reserved in anticipation of the number of responses. While these cards might bias the results towards information technology individuals, the questionnaire did require substantial input on information technology questions as information technology was chosen as a likely to be common function that would permit analysis of the interaction between organisational and divisional plans. The information technology trivia cards did not appear to bias the respondents toward IT in practice. For instance, 58% of respondents did not have a formal IT/IS plan. Only 10% of the respondents had an IT position (IT Director 2%, IT Senior Management 6%, IT Middle Management 2%), while over 74% were Directors (e.g. Chairman 14%, Managing Director 29%, Finance Director 15%, Other Director 14%).
The questionnaires were addressed to “the managing director” in all cases, although it was known that an anonymous title rather than an individual’s name would significantly reduce the response rate. From experience with anonymous titles, the anticipated reduction in response was estimated at about 50%. It was decided that establishing the individual’s name was an expensive exercise, and might as easily lead to a discussion over the telephone of which person in the selected organisation was the most appropriate to receive the questionnaire. It also allowed the organisation to choose who was best placed to complete the questionnaire without undue influence. The questionnaires were sent to the registered company address on the database. Sending to this address was perhaps the single most important factor limiting the response rate. It was known in advance that many of these addresses were not active company addresses, e.g. solicitors or accountants for the company. Further, these addresses were frequently subject to ‘junk’ mail using similar techniques and it could be anticipated that mail sent to these addresses would be submitted to stringent screening.
The questionnaire was designed against a set of criteria for testing. Importantly, four control questions were asked to ascertain the respondents understanding of the size of their company (annual turnover, profit net before tax, capital employed, number of employees). These control questions were correlated against the database information to ensure that the questionnaire could be used, e.g. was a subsidiary’s response being used for a corporate group’s reply or vice versa. The questionnaire was tested by over 20 individuals before being sent to print. Due to their involvement, several of the questions were re-worded or eliminated and the time necessary to complete the questionnaire reduced to approximately 20 minutes in practice. Final layout and design were in accord with normal commercial questionnaires of this type.
Using the ICC database, a set of commercial organisations was selected with a turnover of between £5 million and £100 million. No attempt was made to eliminate any sector. From this set a pseudo-random selection of 5,000 firms was made using a computer. On the reverse of the questionnaire was printed a control number. This number was the registered company number of the firm being sent the questionnaire. This number permitted the correlation with the control questions on size and ensured that the final questionnaire could be used in the statistical analysis.
The anticipated response rate to the questionnaire was 5%. The anticipated response was based on previous response rates to ‘cold’ questionnaires. ‘Cold’ lengthy questionnaires or direct mail campaigns for commercial return typically resulted in 2% to 3% response rate. Questionnaires to a tighter audience who might benefit from the results, e.g. all of the approximately 500 recently-created National Health Service Trusts in 1992, could gain initial response rates without follow-up of approximately 50%. However, these questionnaires were two pages or less, sent to a known person at an active address. A rule of thumb was that each additional page of questions reduced the response rate by 5%. The rule of thumb also dictated a maximum length of 10 pages.
197 organisations responded to the questionnaire, a response rate of 3.9%. Of these, 183 questionnaires were accepted, a successful response rate of 3.7%. The reasons that these 14 were rejected were totally due to either significant gaps in the questionnaires (5) or no correlation between the control questions and the published information (8), frequently public sector or voluntary sector bodies related to a limited company. One questionnaire was returned too late to be of use.
Correlation between the control questions and the published information was taken as plus or minus 50%. During statistical analysis, the average deviation was less than plus or minus 10% which was surprisingly high and probably indicated the seriousness with which some participants took the questions. An exact match was not sought, simply an indication that the entity of 18 months earlier, when the results were filed, was substantially the same as the one being questioned. When there was no correlation between the control questions and the published information it was assumed that a significant merger, disposal, or parent/subsidiary relationship was involved. This situation was known in six of the cases. It was not anticipated that the correlations would be so high between the control questions and the published information. It was thought that between 15% and 30% would have to be rejected due to inaccurate statements about their own company’s size. For instance, respondents would typically have to consult their own accounts to complete the figure for capital employed. In the event, 4% (8) of the questionnaires were rejected due to poor control question answers. This could indicate that respondents knew these figures quite well or took significant effort to complete the questionnaires. It could be argued that the rejection of questionnaires with poor control question correlation would eliminate high or low performers, but such a low number would in any event have had no significant effect on the final results. It could also be argued that the database could be erroneous in these cases. The ICC database does exhibit significant errors from time to time, but importantly, it is used by corporate researchers for a number of performance measurement calculations which does weed out egregious errors.
35 of the non-respondents were telephoned in order to determine whether there might be some point in questionnaire design or approach that had been overlooked. Half of the non-respondents claimed that they had not received the questionnaire. This was not surprising given the use of the registered company address and the anonymous “managing director” title. The remainder showed no overriding reason for not responding, and often multiple reasons, such as “our policy is not to respond to questionnaires”, “this is sensitive information/we need authority to complete this”, “we just don’t have time to complete this questionnaire”, “the questionnaire is too long”, “we need to meet to discuss who would be best placed to complete this”. None of these non-respondents were pressured into replying, and in any event only one sent their questionnaire in. As the telephone follow-up was conducted at a late stage only to determine the reasons for non-response, this reply was too late for inclusion in any case.
The respondents were overwhelmingly directors, 75%. Almost all of the organisations were commercial organisations with turnover exceeding £5 million annually. The results were published as A Study of Strategic Practice and sent to the respondents.
4. Participants
The results came from a 10 page detailed “Strategy Questionnaire”, completed in late 1991 by 183 organisations of varying sizes from different industry sectors. The research explored in detail the following:
- what types and sizes of organisation carry out strategic planning and IT planning?
- does the organisation benefit from strategic planning and IT planning?
- what is important in developing the strategic plan, what is included and how is progress towards goals measured?
- who is responsible for strategic and IT planning, to whom is it communicated and who is involved in its implementation?
- what tools and methodologies are used in developing the strategic plan?
- how is the IT plan integrated with the business strategy and what does it consist of?
- what technologies have been examined, piloted or used?
We also conducted interviews with 27 of the participants to further clarify some of the initial findings.
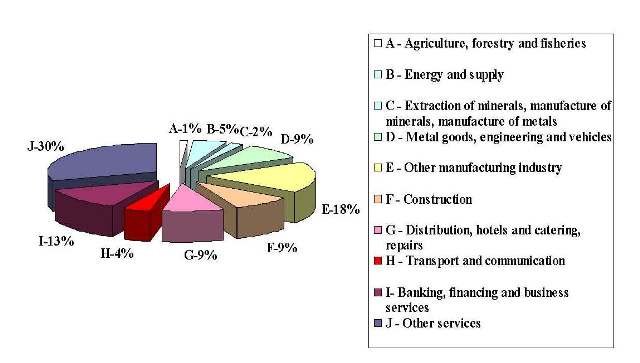
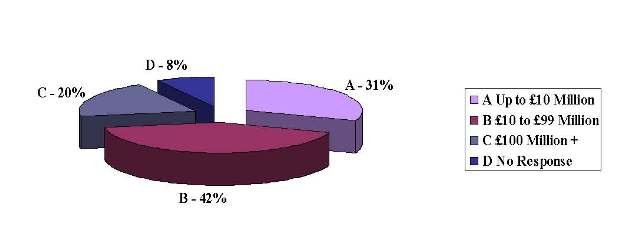
As Chart 1 shows above, the largest proportion of responses were received from other services, manufacturing, and banking and finance. The participating organisations have been split in terms of turnover into three major groups. This split is shown below in Chart 2.
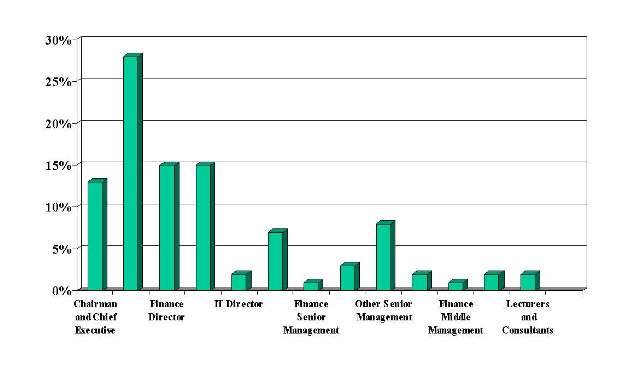
Respondents from the organisations were asked to indicate their position in the company. The main group is at Director level, approximately 74%. The next group are Senior Managers (19%) with the remainder middle management (6%). The detailed breakdown is given below in Chart 3.
Respondents were asked what influence they felt they had over strategic planning and IT planning. Of the respondents at Director level, the majority felt they had a strong influence over business strategy except the 3% who were involved specifically in IT. Only 9% of non IT Directors felt they had a weak influence on IT planning.
5. Our Findings
Planning is Popular
Planning is popular, with 90% of participating organisations either using or developing strategic plans. The survey found that 65% of the participating organisations have a formal plan and of those who did not, over 50% had a plan but it had not yet been formalised and a further 15% were about to prepare one soon.
Less than half, 42%, of organisations have a formal IT plan, with a further 20% using an informal plan.
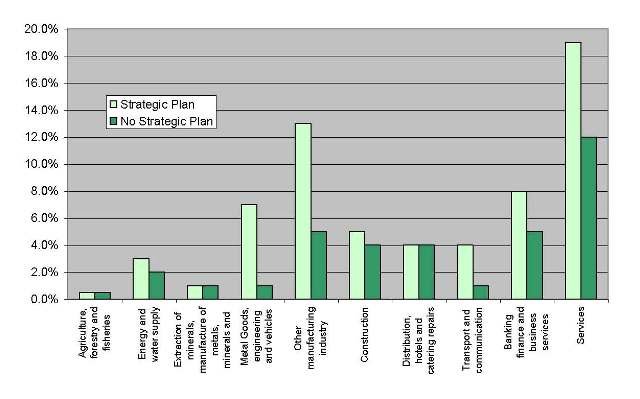
Strategic planning and IT planning are not restricted to particular business sectors. Charts 4 and 5 show the differences in each sector.
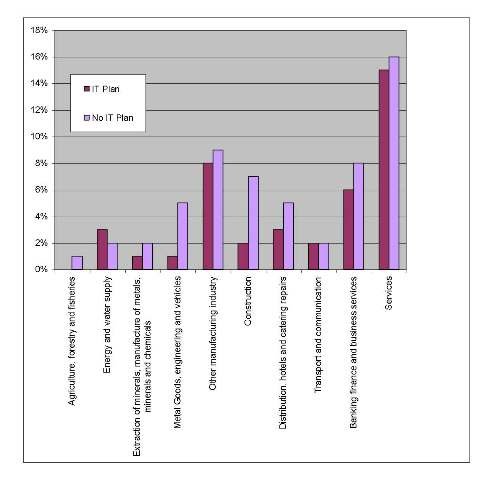
It is interesting that once organisations adopt a formal strategic planning process they do not abandon the plan because they find it ineffective. Only 2% had abandoned their IT plans.
The need for technical knowledge was recognised in the ability to prepare IT plans. Only 9% of organisations did not have the resources or expertise required to develop strategic plans but 24% gave this as the reason for not formulating an IT plan.
No Right Way to Plan
The results show that 67% of organisations do not follow philosophies or use methodologies developed by recognised strategists. This suggests that companies have developed their own approaches to strategic planning based upon a mixture of philosophies or have merely developed their own approach to planning.
69% of participants agreed with the statement:
“A successful strategic plan should predict the future performance of a company”
63% of participants agreed with the statement:
“A strategic plan cannot be effective unless it sets financial targets”
When asked to identify how progress towards specific goals is defined, 83% of the participants who had a strategic plan use financial targets and 64% develop quantified non-financial targets. Only 25% issued competitive targets.
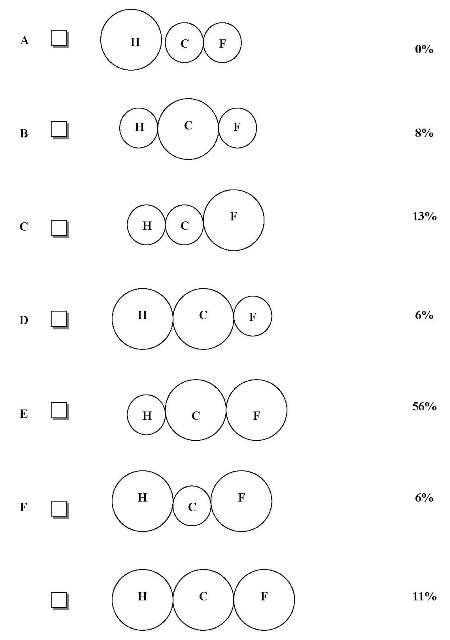
Most organisations, 56%, placed emphasis on current and future performance in the management of their business. No organisation placed emphasis on historic performance only.
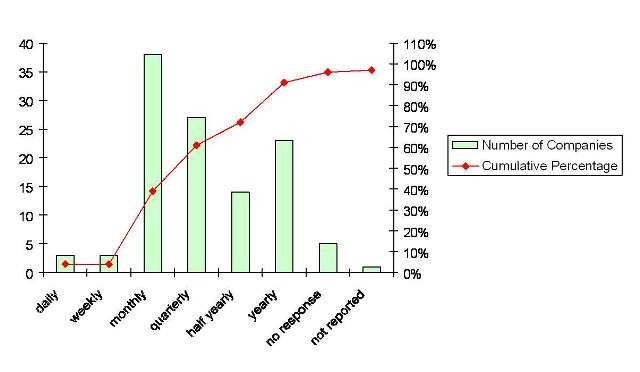
The majority of organisations use a 3 or 5 year planning horizon with annual reviews (what is wrong with 2 years or 4 years?). This would seem to imply that planning is not related to specific business cycle problems or competitive pressure. These results are shown in Charts 6 and 7.
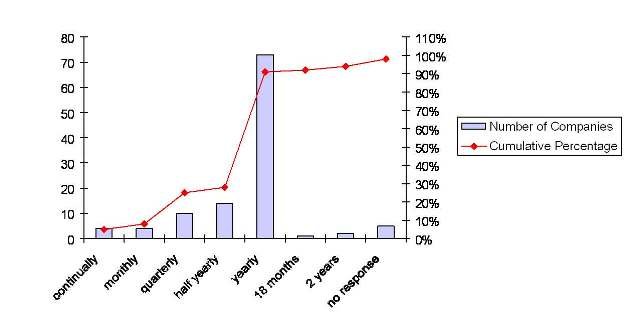
Progress is reported mainly on a yearly basis, Chart 8.
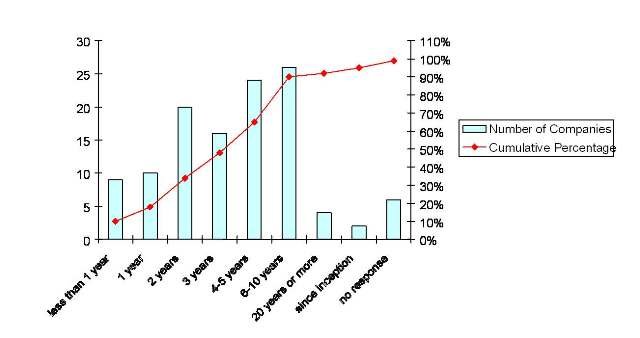
Few organisations have been planning for more than 10 years, Chart 9.
The majority of organisations use a mission statement, market research and SWOT analysis in developing the strategic plan. Only a quarter of organisations use an executive information system to complement the strategic plan. Only a third use competitor analysis.
Organisations Feel They Benefit From Planning
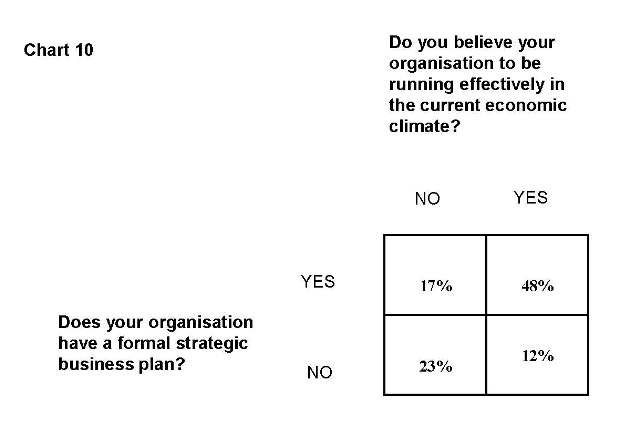
71% of organisations felt they were running effectively. Chart 10 shows the split between organisations with a strategic plans and those without.
Participants were asked to give reasons why they felt they were either running effectively or not in the current economic climate. There was little difference in the answers given for those who had strategic plans and those who did not. However there was more tendency for those with strategic plans to examine key performance indicators, market share and competitor activity.
93% of participants agreed, and none disagreed, with the statement:
“The use of corporate planning can improve the performance of an organisation”
In the body of the questionnaire, of those organisations who had a formal strategic plan, 69% felt that it had been effective in leading to better performance. Organisations felt they had benefited through setting milestones and achieving the goals and objectives set out in the plan. Only 5% commented that it had made better use of resources although 68% achieved cost savings through its implementation.
We asked if:
“Planning is often wasted due to rapid changes to the organisation or in the environment”
The responses were fairly evenly split with 36% agreeing, 42% disagreeing and 21% remaining neutral or not responding.
Of those participants who did not have a strategic plan. 27% of respondents who said that planning was ineffective gave the reason that the business environment was too complex or uncertain.
78% believed that “The use of IS/IT strategic planning can improve the effectiveness of IT in an organisation” but our responses show only 42% have an IT plan.
Of those who developed IT plans 72% felt that this had resulted in more effective use of IT as it had aligned the IT strategy with the business. In contrast to strategic planning, 76% felt they had benefited as they had made better use of resources.
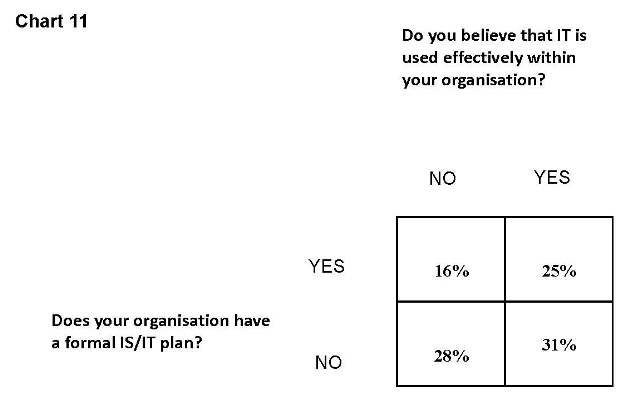
Chart 11 indicates that 25% of those who have a formal IS/IT plan feel that IT is used effectively in their organisation.
Of those who felt that an IT plan was not effective, a high percentage, 83% gave the reason that it was too early to tell.
Organisations, whether they had an IT plan or not, generally thought they used IT about average or more than average when compared with others in their industry, with only 10% less than average. For those who had a formal IT plan, 33% felt they used IT less than average and over 50% felt they used IT more than average.
The results suggest that there is no relationship between central or distributed processing and IT planning. This was not expected as we felt that organisations who have more complex distributed processing would be more likely to commit more effort to the preparation of an IT plan.
Organisations Feel They Should Integrate Plans
72% agreed with the statement:
“The close integration of business strategy and IS/IT strategy can generate further improvements in performance”.
Only 2% disagreed.
Therefore it was surprising that 59% integrate the corporate plan with the subsidiary business plans and 41% integrate with the functional plans. Only 24% include corporate, functional and business plans as part of their strategic plan.
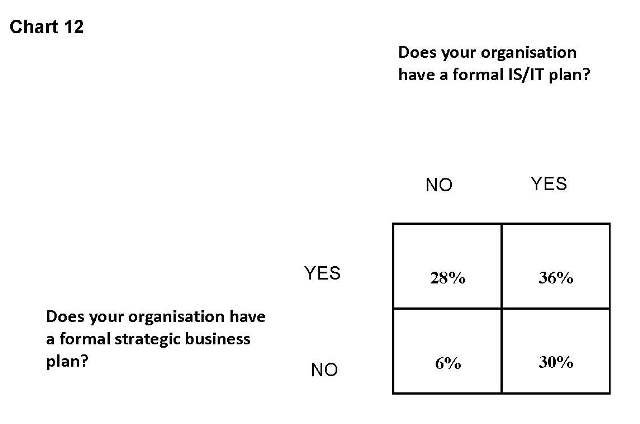
When we consider the integration of strategic planning and IT planning, only 36% of organisations have a strategic plan and an IT plan. The relationship is shown in Chart 12.
Of those organisations who have a strategic plan and an IT plan only 37% fully integrated the IT plan with the business strategy. A further 39% identified IT as a separate function within the overall plan.
Only 26% included information on charging of IT resources to user departments and use of IT by competitors.
Strategic Planning Needs Involvement
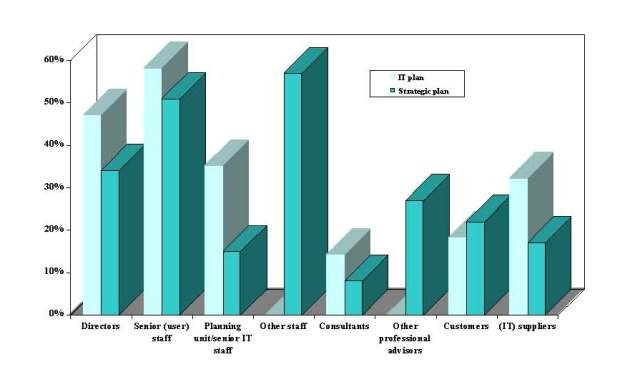
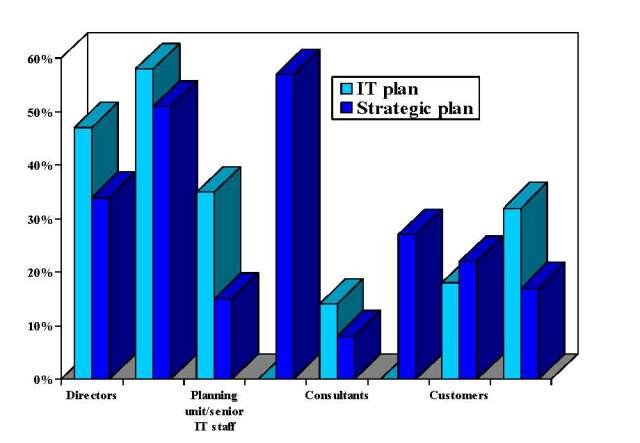
Not surprisingly, the results showed that most organisations felt that the responsibility for the strategic plan lay with the Directors (83%) and Senior Staff (64%). Director responsibility was reduced in IT planning to 43%. Surprisingly for 30% of participants, user staff were responsible for the IT Strategy.
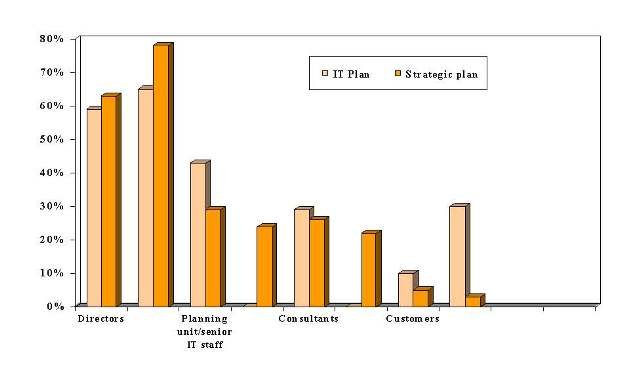
The results showed that there was less director involvement in IT planning than in strategic planning. Organisations also seem to involve their IT suppliers in developing their strategies. Only 11% involved their customers in IT planning although 17% did communicate their strategy to them. Those that involved their IT suppliers did tend to use a preferred supplier.
“For a strategic plan to be successful all staff must know their role”
80% agreed with this statement, and when asked to comment on:
“All successful strategic plans require staff commitment”
90% agreed with this statement.
However only 24% actually involve other staff in its preparation and only 57% communicate the plan to staff in the organisation.
Few Monitor the Cost of Planning
Approximately one third of organisations monitored the financial and man day resources used in preparing a strategic plan, a further third measured the man days resources involved and a third monitored neither. These proportions were repeated for IT planning. However from some of the comments received in these sections, it was apparent that a lot of participants had estimated these figures and did not monitor them.
6. Statistical Analysis
During mid-1992 and during 1993 the questionnaire data was combined with the ICC database information for further statistical analysis. Basic statistical tests were conducted during mid-1992 to attempt to determine whether there were any obvious significant correlations between published financial performance and strategic planning activity. These tests were performed early in order to be of use in the interviews and feedback workshops that were conducted. No significant statistical correlations were found between financial performance and strategic planning activity, and this fact, the lack of correlation, was put forward in interviews and during workshops.
In early 1993, the combined database of 183 organisations and their last five years of published financial information was put into a database in the product DataEase. The basic statistical work was undertaken using the product Lotus 1-2-3. A selected set of the data was taken from DataEase and used in Lotus 1-2-3. The statistical tests were non-parametric because the data typically placed a respondent in a yes/no category. An attempt was made at further analysis using the product SPSS, but time and cost considerations, as well as the lack of early results meant that this was not pursued. The ICC information for the period was May 1993. This database was constructed significantly after the issue of the questionnaire, and while no attempt was made to correlate financial year-ends with the questionnaire responses, it can be assumed that results of the last financial year would have been relatively concurrent with the completion of the questionnaire. Analysis of the database was largely complete by September 1993. The results of the Survey and analysis were used in several case studies after mid-1993.
The approach to the statistical analysis was to set out the primary hypotheses for testing:
- The use of formal strategic planning improves performance;
- The use of formal and informal strategic planning improves performance (based on respondents who indicated informal methods combined with those who claimed formal strategic planning did occur);
- The combination of financial targets and strategic planning improves performance;
- The communication of strategic plans to senior staff improves performance;
- The communication of strategic plans to other staff improves performance;
- The communication of strategic plans to senior and other staff improves performance;
- The combination of formal strategic and information technology planning improves performance;
The success criteria for improved performance were related not just to the other participants, but also to the performance standard of their industry based on the standard industry code (SIC) which was contained on the ICC database. The last three years of available information was used in the statistical tests. This would have been equivalent to 1990, 1991 and 1992 for most companies. Thus the major tests for successful performance were:
- Turnover growth above SIC sector median of the last three years;
- Turnover growth above SIC sector median of other participants over the last three years;
- Profit margin above SIC sector median of the last three years;
- PT4 profit margin above SIC sector median of other participants over the last three years;
- Return on capital employed above SIC sector median of the last three years;
- Return on capital employed above SIC sector median of other participants over the last three years;
- ICC performance score above SIC sector median of the last three years;
- ICC performance score above SIC sector median of other participants over the last three years;
- Value added above SIC sector median of the last three years;
- Value added above SIC sector median of other participants over the last three years;
- Added value above SIC sector median of the last three years;
- Added value above SIC sector median of other participants over the last three years;
- Growing rather than static or declining as reported by participants;
- Better performance as reported by participants.
Therefore, the combination of hypotheses and success criteria consisted of 98 primary tests. Each hypothesis was tested against each of the success criteria using the Phi Coefficient for a two by two table and the associated chi-square statistic. The null hypothesis for each test (H0) is that the Hypothesis does not result in improved performance as measured by the success criteria. Phi Coefficients could range from 0 to 1. Results close to 0 meant that the null hypothesis cannot be rejected. The same was true for chi-square less than 3.84, which was the 5% confidence level.
Chi-square relates to the sizes of differences between the expected frequency of events in a population and the actual frequencies of events in a sample. As the differences increase, chi-square increases and as the differences decrease, chi-square decreases. Chi-square is actually a set of distributions whose shapes vary according to the number of differences. For a chi-square that is exceeded only 5% of the time for four differences, the tables provide a value of 3.84. For a chi-square that is exceeded only 1% of the time, 6.33.
The statistical tests for hypotheses 1, 2, 3, 4, 5, 6 and 7 above provided no evidence to support the hypotheses against the 14 success criteria. Lack of any evidence called into question whether other correlations were being missed for lack of insight.
A number of informal tests were also made, in no particular order. These tests consisted of ‘playing around with the data’. It was hoped that by examining the data, some interesting correlations might emerge for further examination. These tests consisted of:
- Looking at the effects of using the latest year of published account
- Looking at the effects of using all available years (typically four out of the previous five years);
- Looking at the planning horizons and starting dates of planning by SIC code and asset base of firm, e.g. did capital intensive firms strategically plan for longer periods or had they begun strategic planning earlier
- Looking at the effects of excluding firms who had recently begun planning (using several cut-off points);
- Testing the opinions (Section 4) against various performance measures;
- Looking for a planning bias amongst larger firms;
- Looking for a planning bias amongst certain SIC codes.
A further set of supplemental hypotheses was developed after the initial processing. These were also tested:
- Nearly all companies agreed with the statement that the use of corporate planning can improve performance, therefore:
a) Test for those that use formal strategic planning against various success criteria;
b) Test for those that use formal and informal strategic planning against various success criteria;
c) Test for those that reported “better performance” from strategic planning against various external success criteria;
d) Test for differences between the contents of strategic plans against various success criteria;
e) Test for differences in targets set in strategic plans against various success criteria;
f) Test for differences between tools used in strategic planning against various success criteria;
g) Test for the effect of different planning horizons against various success criteria. - The close integration of business strategy and IS can generate further improvements in performance, therefore:
a) Test that companies agreeing with the statement are more likely to integrate Business and IT plans;
b) Test for the effect of integration of business and IT plans against various success criteria. - A strategic plan cannot be effective unless it sets financial targets, therefore:
a) Test for companies agreeing with the statement are more likely to include financial targets in their business plans;
b) Test that the inclusion of financial targets in business plans results in success viz. various success criteria. - For a strategic plan to be successful all staff must know their role. Many companies agree with the statement, therefore:
a) Test for the relationship between companies agreeing with the statement and those that communicate their strategic plans to their staff;
b) Test for communication of business plans to staff against various success factors. - All successful plans require staff commitment. Many companies agree with the statement, therefore:
a) Test for relationship between companies agreeing with the statement and those involving staff/senior in the planning process;
b) Test for involvement of staff leads to success versus various success criteria.
The overall result of the statistical analysis was a significant lack of correlation between financial performance and strategic planning, as well as a lack of correlation between other objective comparative performance and strategic planning. This result, particularly in the UK, is not surprising. Greenley [GREENLEY, Gordon E., “Does Strategic Planning Improve Company Performance?”, Long Range Planning, Vol. 19, No.2, 1986, page 108] found that the research to that date was “far from conclusive in establishing a relationship between strategic planning and company performance”. Further, “although there is a strong a priori case that strategic planning provides a range of both advantages and intrinsic values, empirical evidence is lacking to substantiate these” [Greenley, 1986, pp. 101-109].
In the USA, Boyd conducted a meta-analysis pooling 2,000 organisations from 21 analytical studies selected from some 49 articles. He found some weak correlations linking strategic planning and performance after some adjustments to the data, particularly measurement error and the moderating effects of firm size, but concluded that more research and more rigorous measures would be needed to establish these correlations with any certainty [BOYD, Brian K., “Strategic Planning and Financial Performance: A Meta-Analytical Review”, Journal of Management Studies, Vol. 28, No. 4, July 1991, pp. 353-374].
Hypothesis 5, “the communication of strategic plans to other staff improves performance”, had moderate evidence to show that the communication to staff (rather than just senior management) resulted in below average performance in the profit margin as compared to the ICC sector average (chi-square = 3.39), and the profit margin compared to the SIC median for the last three years (chi-square = 4.37). Perhaps secrecy is the best policy, as attributed to Henry Kissinger, “The only way secrecy can be kept is to exclude from the making of a decision all those who are theoretically encharged with carrying it out” [The Sunday Times, letter from Leonard Street, 18 April 1993, Section 2, page 7].
7. Interviews
The result of the statistical analysis was a conclusion that strategic planning did not correlate with improved financial performance. A number of writers have criticised strategic planning for focusing on financial performance. Nevertheless, amongst a set of commercial firms it would appear that strategic planning should be associated with the more successful firms if strategic planning was a significant contributor to their performance. If strategic planning was not a significant contributor to the firms’ performance, then additional reasons for undertaking strategic planning needed to be sought.
In the questionnaire, participants were asked if they were prepared to spend approximately 90 minutes for an interview. Over half (100) of the participants agreed although, ultimately, only 35 were interviewed. The interviews needed to be flexible, yet test similar issues. An interview programme had to be constructed. This programme consisted of dividing the interviews amongst three interviewers. All of the interviewers (Ian Harris, Stuart Otter, Michael Mainelli) had over five years of experience of dealing with top management on strategic issues. A preliminary meeting was held to discuss the questionnaire and the results of the preliminary statistical analysis. It was agreed that the interviewers would inform participants of some of the initial findings in order to ascertain their responses. It was also agreed that the initial findings would be used to test the stability of the opinions offered in Section 4 of the questionnaire. From this meeting, a number of general questions and discussion points were noted. A standard agenda was constructed which ensured that the interviewers would gather similar information and make similar tests, in line with the opportunities afforded by the interviewer. Since the interviews were conducted, market researchers have started using the term “structured interview” that effectively describes this combination of a standard agenda with guidance for alternative paths during the interview.
During construction of the standard agenda, a set of interview hypotheses (IHs) were agreed. As strategic planning cannot be correlated with improved financial performance, so:
- IH1: Firms may think strategic planning improves financial performance without significant evidence - it was necessary to see if any empirical basis had been sought;
- IH2: Firms may think strategic planning improves their financial performance from what it might have been - could the firm propose any method of ascertaining what might have been;
- IH3: Firms may be unable to determine what strategic planning was - it was necessary to probe their responses to the questionnaire;
- IH4: Firms may not use strategic planning to improve performance;
- IH5: Firms may evaluate the quality of strategic planning by criteria other than the contribution to financial performance;
- IH6: Firms may interpret the term “strategic planning” so loosely, e.g. with no preponderant strategic planning process evident from the questionnaires, that any comparison was impossible. It was decided, where claimed by the participant, to attempt to see evidence of the formal strategic plan and the strategic planning methodology in some written form;
- IH7: The questionnaire may have been poorly designed, improperly completed, completed by an inappropriate person, or inappropriate to the organisation;
There were also interesting anomalies in the questionnaires (QAs) which needed to be examined, including:
- QA1: In an open question, the apparent lack of accuracy, or interest, in tracking the effort or cost of strategic planning – why was there little interest in the cost?
- QA2: In an open question, planning horizons were typically 3 years (35%), 5 years (33%) or 3 to 5 years (7%) – why not even numbers?
- QA3: In an open question, firms reviewed plans annually - was this tied to the budget cycle?
- QA4: A strategic plan did not appear to make better use of resources, (question 10, 5% of those who benefited), while an IS/IT plan did appear to make better use of resources (question 28, second highest response, 76% of those who benefited, with the highest being alignment of IS/IT strategy with business needs at 85%) – was there some difference in the two types of planning?
- QA5: Organisations felt that they should integrate plans (72%), yet only 37% of those who had developed an IT plan integrated it with their business strategy – was there some fundamental reason or misunderstanding?
- QA6: Firms appeared to believe that staff must know their role (80%) or be committed to the strategic plan (90%) for it to be successful, yet only 24% involved staff in the preparation of the strategic plan and only 57% communicated the plan to staff – why the hypocrisy and was there some advantage in secrecy as potentially indicated in the statistical analysis?
The key concern was that a highly regarded process, strategic planning, did not appear to be the object of management scrutiny. How was success measured? Table 1 sets out some of the thinking behind three possible ways of measuring success – standards-based (do they follow certain norms?), comparative (how does our performance compare with other organisations?) or predictive (does our strategic planning help us to predict and therefore anticipate the future?):
Table 1: Means of Measurement versus Purpose
| Means | Quality area | Direction | Commitment | Control | Certainty |
|---|---|---|---|---|---|
| Standard-Based | Output | We have goals? | We are unified in our commitment? | We control through targets? | We know our resource needs? |
| Process | All relevant issues are included? | We are all involved in commitment? | How do we set our targets? | We account for all relevant resources? | |
| Audience | The board are happy with the goals? | The board believe everyone is committed? | The board feel in control? | The board know the limits? | |
| Success | The goals lead to our success? | Total commitment leads to our success? | Meeting targets leads to our success? | Good resourcing leads to our success? | |
| Comparative | Output | Our goals are as good as X’s? | We are as unified as X? | We have control like X? | We know resources as well as X? |
| Process | Our goal process is as good as X’s? | We are as involved in commitment as X? | We set our targets as X? | We include as many resources as X? | |
| Audience | The board are as happy as X’s board? | The board believe we are as committed as X? | The board feel in control as X? | The board know limits as well as X? | |
| Success | The goals work as well as X’s? | Commitment sets our position against X? | Targets set our position against X? | Resource positions us against X? | |
| Predictive | Output | Our plan predicted certain outcomes? | We were committed to the right things? | These were the right targets? | We projected these resource levels? |
| Process | We foresaw this process? | We knew this process would engage the board? | This process increasingly gives the board confidence? | We knew the board would believe this process? | |
| Audience | We knew the board would like this? | We knew this would gain resources from the board? | This plan increasingly gives the board a feeling of control? | We knew the board would believe this plan? | |
| Success | Our plan envisaged this degree of success? | We succeeded through commitment? | We met our targets? | We predicted these limits to success? |
While the standard-based approach can be critiqued at length, standard-based approaches are increasingly common in business. Perhaps some of this popularity is due to the need for guidance in rapidly-changing conditions. Under conditions of rapid change businesspeople may not feel that they have the time to analyse certain situations or design bespoke solutions; they would rather be told what is adequate. Perhaps they find being told what is adequate is a sensible response in conditions of uncertainty, particularly in areas that are relatively unimportant.
While standards emerge constantly, e.g. ISO9000 or views on corporate governance (Cadbury, Greenbury, Hampel, Turnbull), there are emerging standards in both assumptions about the business environment (e.g. the assumption of more rapid change implicit in the previous paragraph) and in the proper response. Convergence in organisational theory is leading to some common assumptions about the nature of a “normative” organisation. Mathur and Kenyon [MATHUR, Shiv S. and Kenyon, Alfred, Creating Value: Shaping Tomorrow’s Business, Butterworth Heinemann, 1997, pages 392-396] provide an overview of eight common assumptions about organisational theory which affect strategic planning:
- Incumbent top management are invariant under most planning processes, i.e. strategic planning is not about changing them;
- Decentralisation is desirable;
- Profit centre autonomy is desirable;
- Inter-unit structures depend on activity, not strategy;
- Strategy formulation is the responsibility of the top few;
- Strategy implementation is part of day-to-day management;
- Profit centres should interact as much as possible through market mechanisms, e.g. cross-charging;
- The same profit centre formulates and implements strategy.
The point to note about these assumptions is that Mathur and Kenyon believe them to be widely accepted. Few of these assumptions would have roused much debate with the interviewees.
One direct question had to be asked identically in all interviews, “how do you measure the quality of your strategic planning system?” This question was meant to be the core question in the interview. A variety of non-committal responses were anticipated and the interviewers were permitted to take two types of lead if necessary. One type of lead was to suggest a handful of measures, particularly standard-based, comparative or predictive, but also to lead on more concrete expressions of these (e.g. financial performance, competitive response, top management views, comparative performance, benchmarking, professionalism). The second type of lead was to focus on the future with open-ended questions such as, “what are your thoughts on future directions for strategic planning within your organisation?” Following this discussion, the preliminary results were supposed to be explained to the interviewee and additional responses sought.
The author led a meeting to brief the two additional interviewers on the interview agenda and to establish the interview programme and approach, e.g. almost all interviews had a lead interviewer and a supporting interviewer. The final target was to interview 35 of the participants. A list was drawn up of the available firms. The interviewers indicated their interest in some of the firms. Some of the interviewers were better placed to interview some of the firms due to the firms’ location (one interviewer in Leeds, one in Milton Keynes). Interviewers attempted to contact firms by telephone. Approximately 70 firms were contacted to attempt to arrange interviews. A combination of interest in the study by the participants combined with availability (not necessarily exclusive attributes) resulted in the final interviewees. While location was a partial factor, no other bias was apparent, except one case where the interviewer was interested in getting behind press commentary on a firm. Location did not prevent firms in Wales and Scotland being interviewed. Each interviewer was given a photocopy of the questionnaire to enable him to prepare for individual interviews and to avoid covering what interviewees might consider old ground. This preparation proved highly useful both in showing participants that their opinions were valued, and in highlighting inconsistencies in participants’ opinions.
By October 1992, when some preliminary results were published, 27 of the organisations had been interviewed for approximately 120 minutes each in an attempt to learn how they measured the quality of their strategic planning process. By mid-1993, 35 of the organisations were interviewed. Most of the intereviews (31) were dual, with a designated lead interviewer and a supporting interviewer taking notes. Half of the interviews (17) were led by the author, half by the other two team members. The author attended 25 interviews in total. There appeared to be no noteworthy differences in one lead interviewer’s experiences compared with the others. There was significant interest during the study in how participants would react to evidence that strategic planning could not be shown statistically to improve financial performance. A meeting was held among the interviewers to gain feedback not available on the interview forms. At this point it was evident that being confronted with evidence that strategic planning had no discernible correlation with improved performance did not appear to disconcert the participants.
The opinion section tended to be the focus of discussion in interviews. Most respondents took a relaxed attitude towards inconsistencies between their questionnaires and their interview positions. As one participant stated about his confirmation on the questionnaire that strategic planning can improve performance, “I would have to say that on any questionnaire”. Taking the opinion questions in turn:
- “The use of corporate strategic planning can improve the performance of an organisation” - the lack of evidence from the statistical analysis resulted in most interviewees suggesting that they were certain strategic planning did improve performance, it was just difficult to measure. Looking at the evidence from those who claimed to conduct formal planning; firstly, they did appear to have written plans and methodologies, and, secondly, there was a wide variety of acceptable methodologies in practice. Despite widespread agreement that the world was a rapidly changing place, few interviewees foresaw major changes to their strategic planning systems, even in the face of the preliminary results;
- “The use of IS/IT strategic planning can improve the effectiveness of IT in an organisations” and “the close integration of business strategy and IS/IT strategy can generate further improvements in performance” - most interviewees continued to assert that this held;
- “A strategic plan cannot be effective unless it sets financial targets” - most interviewees moved to a non-committal stance when confronted with the evidence, some moved significantly away from their questionnaire position. Some even stated that financial targets were an impediment to a good strategic plan. There was general confirmation that strategic planning had some link with the budget cycle, although the degree of linkage was difficult to probe for any conclusive result;
- “a successful strategic plan should predict the future performance of the organisation” - this question exhibited the largest discrepancy between questionnaire (69% agreement, 19% neutral, 9% disagreement) and interview, with no interviewee agreeing with the statement and only two remaining neutral. Also, participants confirmed that 3 and 5 years were the preferred time scale.
- “for a strategic plan to be successful all staff must know their role” and “all successful strategic plans require staff commitment” - interviewees discussed the topic but remained close to their original positions;
- “planning is often wasted because of rapid changes to the organisation or in the environment” - interviewees who agreed with this statement in the questionnaire tended to agree with it in interview. Overall, there was a preponderant view that “the process [of planning] is more important than the plan [that results]”.
The following summary of the interviewers’ summary of the interview hypotheses is fairly direct:
- IH1: Empirical basis - none had been sought by the interviewees;
- IH2: What might have been - most interviewees felt that, though they acknowledged this point was probably erroneously overlooked, there was little point in examining it. “What’s past is past”. The normal response seemed to denigrate introspection;
- IH3: Definition of strategic planning - a difficult discussion point to summarise, but the same activities seemed to be undertaken by similar people at a senior level and were frequently labeled ‘strategic planning’ (>65% of respondents);
- IH4: Strategic planning to improve performance - this elicited several emotional responses, e.g. “why else would we do it!”. Clearly firms believe that strategic planning is undertaken in order to improve performance, although they had not bothered to seek confirmation (IH1 and elsewhere);
- IH5: Other criteria for the quality of a strategic plan - this area provided some of the richest feedback. It became clear that firms had a variety of qualitative criteria which gave them confidence in strategic planning, e.g. staff enthusiasm, evidence of senior management commitment, key insights, informal training, or favourable comments from figures of authority such as financiers, shareholders or senior management advisors;
- IH6: ‘Too loose’ definition of strategic planning - the test of asking to see evidence of a formal strategic plan and an accompanying methodology was, strangely, passed in 100% of the cases where the interviewee had claimed there was a formal strategic plan. From here, interviewers took too many paths to claim any commonality;
- IH7: With the exception of question 29, how IS/IT strategy is integrated with the business strategy where some of the participants found the graphical presentation confusing, participants gave good feedback on the questionnaire design, length and coordination, as well as their treatment as respondents and interviewees.
Interviewers summarized the questionnaire anomalies as follows:
- QA1: Little interest in the cost of strategic planning - most interviewees felt that special projects were always hard to track unless they were large. Strategic planning was seen as a small effort. In some cases, interviewers pointed out that the central effort described had been small, but the firmwide effort was significant in person-hours. This apparently large resource was dismissed by interviewees, typically in comments such as “it is good for managers to think about the business” or “there’s no point in costing get-togethers like our awaydays; we just need them”;
- QA2: No even number horizons - a wry point for most interviewees. It could be assumed that there is some human preference to planning in odd numbers of years;
- QA3: Annual review of plans - strategic planning was seen as something to be done in conjunction with annual budgets;
- QA4: Differing resource benefits from strategic plans (low) and IS/IT plans (high) - most interviewees saw IS/IT plans as budgets, not strategic plans. Interviewees felt similarly about all subsidiary plans. This common response weakened confidence in the use of the words ‘strategy’ and ‘plan’;
- QA5: Lack of IS/IT plan integration with strategic plans - most interviewees felt that they had been inconsistent. On reflection, IS/IT planning was primarily budgeting (QA4), and their apparent contradiction was a recognition that the strategic plan was about the firm’s strategy, not its budgets, although, yes (QA3), it did seem tied to the annual budget cycle;
- QA6: Hypocrisy over commitment and secrecy - interviewees were as bemused as the interviewers. When the weak correlation between secrecy and success was revealed, the only correlation at all, bemusement only increased. There was little insight gained into this anomaly, except that strategic plans are frequently senior management exercises with little structured communication to other employees.
Little progress was made on examining strategic planning’s relationship with IS/IT strategy on the two important anomalies, viz., better use of resources and IS/IT integration. Respondents tended to feel the issue was of little importance compared with other issues. They also tended to feel that IS/IT strategy was closer to actual expenditure decisions and thus should be more amenable to resource utilisation measures and less answerable to strategic planning issues. When probed deeper by raising the issue of “IT for strategic or competitive advantage”, most interviewees were unable to place IS/IT on a par with the strategic issues foremost in their minds, viz. market share, profitability, growth, competitors or government. This response is largely in line with Gallier’s findings [GALLIERS, Robert D., “A Failure of Direction”, Business Computing and Communications”, July-August 1986]. IS/IT was clearly a means to an end, in contrast to academic assertions to the contrary, e.g. “managers must understand that at the heart of these new strategic responses is innovative management through advanced information technologies” [BOYNTON, A.C., VICTOR, B., and PINE II, B.J., “New Competitive Strategies: Challenges to Organizations and Information Technology”, IBM Systems Journal, Vol. 32, No. 1, 1993, page 40]. It also appeared that interviewees were clear on the distinction between strategic planning and subsidiary plans such as IS/IT, marketing, personnel, divisional, departmental, etc.
The response to the question, “how do you measure the quality of your strategic planning system?”, typically evoked replies such as, “what an interesting question” or “I’ve never been asked that before”. It was here that the use of measurement of the effort or cost of strategic planning was largely dismissed. Interviewees who had stated an effort or cost estimate admitted that their response had been largely guesswork. All interviewees felt that the effort or cost of the strategic planning process was largely inconsequential to the potential benefit. Interviewees also felt that the ability to measure the effort or cost would be complicated by the multiple tasks of managers or planners. In addition, most interviewees felt that measuring the effort or cost would not provide information of more benefit than it would cost to collect accurately. Personal feelings about the costs of planning pre-dominated, e.g. “I think we spend about the right amount here”.
When interviewees were challenged on the quality of their strategic planning process, they relied on their feeling, or the general management feeling about the resultant plan. A typical reply was, “if we feel we have a good plan”. This reply had been anticipated and when this or a similar reply was encountered the interviewers went on to pursue what constituted a good plan. In discussion a number of options were discarded, financial performance, comparison with competitors, post-evaluation, etc. Despite considerable interest in ISO9000 (48% very important, 30% important), interviewees had little interest in the application of ISO9000 to strategic planning systems. Interviewees also had little interest in benchmarking strategic planning systems, despite general interest in benchmarking. Interviewees agreed, with one exception (who declined to pursue the topic), a high-quality strategic planning system was one that either the strategic planner or top management felt had produced a good plan or planning process. Further restatement by the interviewer towards the end of the interview took the form of saying something similar to, “so, in conclusion, would you agree that strategic planning is something you do to help you feel better about the future?” This statement was widely accepted.
8. Feedback
Upon circulation of the document “A Study of Strategic Practice” in October 1992, two letters and one telephone call were received. All three indicated their appreciation of the study. A small number of the interviewees were encountered during the period of the study and indicated their interest in having a general discussion. A more academic discussion was conducted at the London School of Economics and Political Science on 4 November 1992 with about 20 participants under the title of “Strategic Planning: Why Bother?”. A discussion was held in 1993 at the BDO offices, where 30 of the participants attended. The discussion consisted of 45 minutes of presentation followed by approximately 30 minutes of formal discussion and 45 minutes of informal discussion. The general mood of the meeting was convivial. Although little new insight was gained, again, surprisingly, the participants in the discussion were not disconcerted by evidence that there was no conclusive evidence that strategic planning correlated with improved financial performance. As one participant commented, “it was refreshing to see someone honestly express something I have suspected for some time”. When confronted with a tentative conclusion, “we engage in strategic planning because it helps us feel better about the future”, there appeared to be significant agreement.
Inevitably, more investigations could have been undertaken with more time and more money. However, it fell to further case studies and two seminars in 1993 and 1994 to form the basis of testing the reception of the tentative conclusions of the Survey and interview work (viz., there is no correlation between strategic planning and improved financial performance; people engage in strategic planning because it helps them feel better about the future) with other organisations. The reception in seminars and case studies was typically very warm. Interestingly, despite all of the testing, and contrary to much of the literature, no one ever claimed that the Survey was wrong because they had evidence that strategic planning had clearly helped them.
A final effort was made to contact a random sample of 50% (92) of the participants by telephone during September and October 1994. This effort was designed merely to see if the participants had been transitory and perhaps not in a position to speak accurately for their organisations. The results might also indicate whether strategic planning was so transitory that it was unlikely to have a lasting impact on the organisations that conducted it. 50% of the 50% (25% or 46 people) were contacted. No significant further comments arose, nor were any further conclusions drawn. Interestingly, of the 25% (46) who could not be contacted, almost all had left the company or were unable to be found by their switchboard (not uncommon in large companies). Those who remembered the Survey were asked if their opinions had changed. There were no significant conversations to report, although most remarked that the Survey and/or interviews had been some time ago (three years).
9. Purpose of Strategic Planning
One could conclude that people measure success in strategic planning by how much it helps them feel better about the future. This is not to be confused with the reason they begin strategic planning. The Survey summarised the reasons people began strategic planning under four purposes. Table 2 expands on the purposes, typical characteristics associated with a purpose, some sub-purposes and the typical desired output from strategic planning.
Table 2: Sub-Purposes of Strategic Planning
| Purpose | Characteristics | Sub-Purpose | Output |
|---|---|---|---|
| Set Direction |
End, unbounded Soft/intuitive Goal-oriented Flexible |
Organisational identity Communication Competitive reactions, opportunities Issue clarification Creativity, insight |
Strategy - - Statement of situation, - Issues, - Approach, - Goals |
| Gain Commitment |
End, unbounded Soft/inexact People-oriented |
External approval, commitment to resource Internal approval, inspiration Training in strategic thinking Team-building Unity of approach |
Mission/vision - - Agreement on situation, issues, approach, goals, experiences of people |
| Keep Control |
Means, bounded Hard/measurable Structure-oriented Discipline Inflexible |
Hierarchy of objectives Identify improvements Setting constraints and allocating resources Targets and monitoring Information sharing Reduce duplication |
Plan of Action - - Definition of structure, objectives, timing, resources, procedures, responsibilities |
| Resolve Uncertainty |
Means, bounded Hard/analytical Problem-oriented |
Confirm assumptions used in daily decisions Set priorities Pivotal decisions for large-scale issues Resource projection Set risk structure |
Priorities - - Programmes, policies, projects, common agreed data |
These four purposes were often portrayed during seminars by the author, as in Diagram 1: Strategic Planning Flavours, which emphasises that “setting direction” is almost a constant factor.
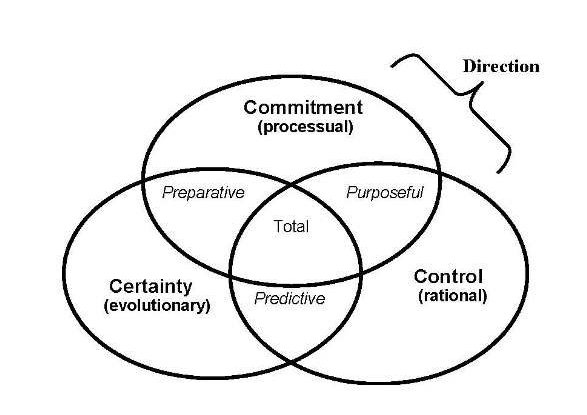
From the literature and the Survey, the flavours of strategic planning had been simplified to three: commitment, certainty and control. The links between this model and van der Heijden’s three schools of strategy (in parentheses in Diagram 1) is strong, but independently developed [VAN DER HEIJDEN, Kees, Scenarios: The Art of Strategic Conversation, John Wiley & Sons, 1996, page 49].
The Survey and analysis had indicated that strategic planning was an imprecise process and one that could not be proven to improve performance.
APPENDIX - Responses to survey
SECTION 1 – BUSINESS PROFILE
Q1. Which of the following classifications best describes your business area? (tick one only):
| Agriculture, forestry or fisheries | 1% |
|---|---|
| Energy and water supply | 5% |
| Extraction of minerals; manufacture of metals, mineral products and chemicals | 2% |
| Metal goods, engineering and vehicles | 9% |
| Other manufacturing industry | 18% |
| Construction | 9% |
| Distribution, hotels and catering: repairs | 9% |
| Transport and communication | 4% |
| Banking, finance, insurance, business services and leasing | 13% |
| Other services | 30% |
Q2. What is the primary activity of your organisation? (tick one only):
| Manufacturing | 30% |
|---|---|
| Distribution | 11% |
| Retail | 8% |
| Service | 51% |
Q3. Is your organisation (please tick one of each pair):
| Growing | 73% |
|---|---|
| Static/Declining | 25% |
| No Response | 2% |
| Centralised | 53% |
| Decentralised | 43% |
| No Response | 4% |
| National | 61% |
| Multinational | 33% |
| No Response | 6% |
Q4. Do you believe your organisation to be running effectively in the current economic climate?
| Yes | 72% |
|---|---|
| No | 27% |
| No Response | 1% |
Q5. Please give approximate values for your organisation of:
(Answers different for each organisation)
| Annual Turnover |
| Profit (net before tax) |
| Capital employed |
| Number of Employees |
SECTION 2 – CORPORATE STRATEGIC PLANNING
Q6. Does your organisation have a formal strategic business plan?
| Yes | 65% |
|---|---|
| No | 35% |
Q7. If no formal strategic business plan exists, is this because (tick any appropriate) [more than 100% possible]:
| A plan exists but has not been formalised | 55% |
|---|---|
| The business situation is too simple to require a formal plan | 9% |
| The business situation is too complex or uncertain for planning | 3% |
| It is felt that strategic planning cannot improve performance | 8% |
| You feel strategic planning would be effective and want to prepare one soon | 15% |
| Strategic planning has been tried but found to be ineffective | 0% |
| The resources or expertise required to develop a plan are not available | 9% |
Q8. Has the strategic plan been effective in leading to better performance?
| Yes | 69% |
|---|---|
| No | 28% |
| Both | 3% |
Q9. If no, why not? (tick any appropriate) [more than 100% possible]:
| It is too early to tell | 64% |
|---|---|
| Specific objectives were not identified | 3% |
| No milestones for the achievement of objectives were defined | 15% |
| Did not solicit input to corporate strategy from staff | 6% |
| Did not gain commitment of staff to corporate strategy | 18% |
| The business environment was too complex or uncertain | 27% |
| The plan was unrealistic | 3% |
| The organisation did not possess the necessary planning skills | 12% |
Q10. If yes, how has the organisation benefited? (tick any appropriate) [more than 100% possible]:
| Achieved goals and objectives set in the plan | 81% |
|---|---|
| Specified milestones for achievement of goals and objectives | 77% |
| Gave all staff a unified vision of the company | 64% |
| Targeted investment in areas of greatest opportunity | 51% |
| Identified new markets or ideas | 51% |
| Achieved cost savings | 68% |
| Made better use of resources | 5% |
Q11. Which of the following diagrams best depicts the emphasis placed on historic performance (H), current performance (C), and future plans (F) in the management of your business? For example diagram A represents most emphasis on historic performance (tick any one diagram).
Q12. Please indicate the current importance of strategic planning to each of the functional areas within your organisation (tick any appropriate):
| Not Important | Important | Very Important | No Response | |
|---|---|---|---|---|
| Finance/Accounts | 13% | 45% | 37% | 5% |
| Marketing/Sales | 2% | 25% | 70% | 3% |
| Manufacturing | 33% | 23% | 22% | 22% |
| Transport/Distribution | 42% | 30% | 9% | 19% |
| Customer Service | 7% | 22% | 65% | 6% |
| Research/Design | 24% | 31% | 26% | 19% |
| Human Resources | 7% | 42% | 43% | 8% |
| General Management | 3% | 47% | 43% | 7% |
Q13. What does the formal strategic plan consist of? (tick any appropriate) [more than 100% possible]:
| Mission statement (well known) | 72% |
|---|---|
| Corporate plan | 90% |
| Subsidiary business plans (for each major business area) | 77% |
| Functional plans (for each function such as marketing) | 55% |
| Integration of corporate plan with subsidiary business plans | 59% |
| Integration of corporate plan with functional plans | 41% |
Q14. How does the strategic plan define progress toward specific goals? (tick any appropriate) [more than 100% possible]:
| Financial targets (such as ROCE, earnings per share) | 83% |
|---|---|
| Quantified non-financial targets such as market share, quality levels) | 64% |
| Unquantified non-financial targets (such as customer survey results) | 36% |
| Competitive targets (such as lowest cost producer in the industry) | 25% |
Q15. Please state what planning horizon you use?
| Under 1 year | 7% |
|---|---|
| 1 to 3 years | 8% |
| 3 years | 35% |
| 3 to 5 years | 7% |
| 5 years | 33% |
| 5 to 15 years | 3% |
| No response | 8% |
How often is the strategy renewed?
| Continually | 3% |
|---|---|
| Monthly | 3% |
| Quarterly | 8% |
| Half yearly | 13% |
| Yearly | 63% |
| 18 months | 1% |
| 2 years | 3% |
| No Response | 6% |
How often progress against strategic targets is reported?
| Daily | 3% |
|---|---|
| Weekly | 3% |
| Monthly | 33% |
| Quarterly | 23% |
| Half yearly | 12% |
| Yearly | 19% |
| Not reported | 1% |
| No response | 8% |
How long have strategic plans been prepared in your organisation?
| Less than 1 year | 8% |
|---|---|
| 1 year | 8% |
| 2 years | 17% |
| 3 years | 14% |
| 4 to 5 years | 20% |
| 6 to 10 years | 22% |
| Over 20 years | 3% |
| Since inception | 2% |
| No response | 6% |
Q16. How much resource is used annually in preparing and reviewing the strategic plan?
Answers different for each organisation
- In man days
- In financial terms
Q17. Who is involved in formulating the strategic plan, to whom is it communicated, and who is responsible for implementation? (tick any appropriate) [more than 100% possible]:
| Involved | Communicated | Responsible | |
|---|---|---|---|
| Directors | 64% | 34% | 83% |
| Senior Staff | 78% | 51% | 64% |
| Planning unit staff | 29% | 14% | 9% |
| Other staff | 24% | 57% | 17% |
| Customers | 7% | 23% | 0% |
| Suppliers | 4% | 16% | 0% |
| Professional Advisers | 22% | 27% | 2% |
| Consultants | 24% | 8% | 1% |
Q18. Do you use any of the following in developing your strategic plans? (tick any appropriate) [more than 100% possible]:
| Workshops | 10% |
|---|---|
| Mission Statements | 69% |
| Executive information systems | 26% |
| Market research | 64% |
| Portfolio theory | 8% |
| '7S' framework | 3% |
| Value chain/cost chain analysis | 14% |
| Risk analysis | 38% |
| Cost/benefit analysis | 42% |
| SWOT analysis | 57% |
| Competitor analysis/five forces analysis | 37% |
Q19. Do you use or follow the philosophy of, or methodologies developed by, any of the following? (tick any appropriate) [more than 100% possible]:
| Porter | 16% |
|---|---|
| Ohmae | 3% |
| Peters | 16% |
| Drucker | 12% |
| Argenti | 5% |
| London Business School | 3% |
SECTION 3 – INFORMATION SERVICES/ TECHNOLOGY (IS/IT) STRATEGIC PLANNING
Q20. Please indicate the reason for using IT in each of the functional areas within your organisation (tick any appropriate, if IT is of no importance to a function please leave blank) [more than 100% possible]:
| Strategic | Information gathering | Cost saving | |
|---|---|---|---|
| General Management | 44% | 76% | 37% |
| Marketing/sales | 39% | 75% | 16% |
| Transport/distribution | 13% | 23% | 18% |
| Finance/accounts | 45% | 81% | 60% |
| Research/design | 17% | 21% | 13% |
| Manufacturing | 9% | 21% | 23% |
| Human resources | 11% | 56% | 23% |
| Customer service | 31% | 54% | 27% |
Q21. To what extent does your organisation use IT compared to others in the industry?
| Less than average | 10% |
|---|---|
| About average | 47% |
| More than average | 41% |
| No response | 2% |
Q22. Do you believe that IT is used effectively in your organisation?
| Yes | 51% |
|---|---|
| No | 44% |
| No response | 5% |
Q23. Within your organisation is IT organised (tick one only):
| Centrally | 53% |
|---|---|
| Distributed | 40% |
| Both | 4% |
| No response | 3% |
Q24. Does your organisation have a formal IT/IS plan?
| Yes | 42% |
|---|---|
| No | 58% |
Q25. If no formal IS/IT strategic plan exists, is this because (tick any appropriate) [more than 100% possible]:
| A plan exists but has not been formalised | 36% |
|---|---|
| IT is not strategically significant to your business | 14% |
| The situation is too complex or uncertain for effective planning | 7% |
| It is felt that strategic IS/IT planning cannot improve performance | 2% |
| Strategic IS/IT planning has been tried but found to be ineffective | 2% |
| The resources or expertise required to develop a plan are not available | 24% |
Q26. Has the strategic IS/IT plan resulted in more effective use of IT?
| Yes | 72% |
|---|---|
| No | 24% |
| No response | 4% |
Q27. If no, why not? (tick any appropriate) [more than 100% possible]:
| Too early to tell | 83% |
|---|---|
| IS/IT strategy was not aligned with business needs | 28% |
| Specific objectives were not identified | 28% |
| No milestones for the achievement of objectives were defined | 17% |
| Did not solicit input to IS/IT strategy from staff | 17% |
| Did not gain commitment of staff to IS/IT strategy | 28% |
| The business environment was too complex or uncertain | 17% |
| The plan was unrealistic | 22% |
| The organisation did not possess the necessary planning skills | 22% |
Q28. If yes, how has the organisation benefited? (tick any appropriate) [more than 100% possible]:
| Aligned IS/IT strategy with business needs | 85% |
|---|---|
| Achieved specific goals and objectives set in the plan | 64% |
| Specified milestones for achievement of goals and objectives | 51% |
| Targeted IT investment in areas of greatest opportunity | 56% |
| Coordinated technology policies | 60% |
| Better use of IT resources | 76% |
Q29. Which of the following diagrams best depicts the degree to which the IS/IT strategy (IT) is integrated with the business strategy (BS)? (tick any one diagram):
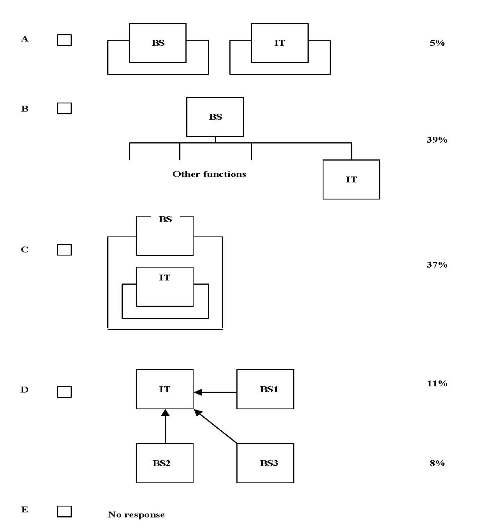
Q30. What does the formal strategic IS/IT plan consist of? (tick any appropriate) [more than 100% possible]:
| An IS/IT strategic plan | 70% |
|---|---|
| Integration with the corporate business plan | 54% |
| Integration with subsidiary business plans | 41% |
| Integration with functional plans | 43% |
Q31. Who is involved in preparing the IS/IT strategy, to whom is it communicated, and is responsible for implementation? (tick any appropriate) [more than 100% possible]:
| Involved | Communicated | Responsible | |
|---|---|---|---|
| Directors | 59% | 47% | 47% |
| Senior user staff | 66% | 59% | 30% |
| Senior IT staff | 43% | 36% | 64% |
| IT suppliers | 30% | 33% | 11% |
| Customers | 11% | 17% | 1% |
| Consultants | 29% | 13% | 5% |
Q32. Which of the following areas are covered by the strategic IS/IT plan? (tick any appropriate) [more than 100% possible]:
| Priorities in support of business plans | 68% |
|---|---|
| Research into innovative use of IT | 38% |
| Use of IT by competitors | 22% |
| Hardware | 84% |
| Software | 88% |
| Communications | 83% |
| IT staff | 57% |
| The organisation of the IT provision | 63% |
| Charging for the use of IT resources | 26% |
Q33. How much resource is used annually in preparing and reviewing the strategic IS/IT plan?
(Answers different for each company)
- In man days
- In financial terms
Q34. Which of the following technologies has your organisation piloted or used? (tick any appropriate) [more than 100% possible]:
| Examined | Tested | Used | |
|---|---|---|---|
| CAD/CAM | 13% | 9% | 38% |
| EDI (Electronic Data Interchange) | 26% | 16% | 29% |
| DTP (Desk Top Publishing) | 28% | 22% | 60% |
| DIP (Document Image Processing) | 19% | 9% | 16% |
| CIM (Computer Integrated Manufacture) | 5% | 3% | 9% |
| EIS (Executive Information Systems) | 24% | 15% | 20% |
| CD-ROM | 10% | 5% | 13% |
| SWIFT/BACS | 17% | 9% | 38% |
| Robotics | 5% | 3% | 8% |
| Event-based or dynamic simulation | 4% | 3% | 5% |
| Bar codes /optical scanning | 18% | 9% | 28% |
| Expert or knowledge based systems | 14% | 6% | 12% |
| Voice messaging | 9% | 3% | 9% |
Q35. Do you deliberately use a variety of suitable suppliers in each area of IT requirement or do you attempt to use a preferred supplier?
| Variety | 45% |
|---|---|
| Preferred | 50% |
| Both | 1% |
| No response | 4% |
Q36. The results of this survey will be more useful if we can estimate the size of IT operations in your organisation. This is not easy to measure so please complete as many of the following as you can:
(Answers different for each company)
- What is your total annual spend on IT?
- How many of your employees work in IT or DP?
- How many keyboards/terminals/PCs do you use?
SECTION 4 – OPINIONS
Q37. Underlying this survey are a small number of basic theses which we are trying to test. Some of these are listed below and we would value an indication of whether you agree or disagree with them.
The use of corporate strategic planning can improve the performance of an organisation.
| Agree | Disagree | Neutral | No response |
|---|---|---|---|
| 93% | 0% | 4% | 3% |
The use of IS/IT strategic planning can improve the effectiveness of IT in an organisation.
| Agree | Disagree | Neutral | No response |
|---|---|---|---|
| 79% | 2% | 19% | 2% |
The close integration of business strategy and IS/IT strategy can generate further improvements in performance.
| Agree | Disagree | Neutral | No response |
|---|---|---|---|
| 72% | 2% | 23% | 3% |
A strategic plan cannot be effective unless it sets financial targets.
| Agree | Disagree | Neutral | No response |
|---|---|---|---|
| 67% | 13% | 17% | 3% |
A successful strategic plan should predict the future performance of an organisation.
| Agree | Disagree | Neutral | No response |
|---|---|---|---|
| 69% | 9% | 19% | 3% |
For a strategic plan to be successful all staff must know their role.
| Agree | Disagree | Neutral | No response |
|---|---|---|---|
| 80% | 6% | 11% | 3% |
All successful strategic plans require staff commitment.
| Agree | Disagree | Neutral | No response |
|---|---|---|---|
| 91% | 1% | 5% | 3% |
Planning is often wasted because of rapid changes to the organisations or in the environment.
| Agree | Disagree | Neutral | No response |
|---|---|---|---|
| 37% | 42% | 18% | 3% |
SECTION 5 – THE FUTURE
Q38. Please indicate whether you expect any of the following areas to be of importance to your organisation either now or in the future? (tick any appropriate) [more than 100% possible]:
| Very Important | Important | Unimportant | |
|---|---|---|---|
| ISO 9000/BS 5750 | 48% | 30% | 8% |
| Environmental audit/costing | 11% | 27% | 42% |
| Risk management | 16% | 41% | 25% |
| Strategies for Chaos/Change management | 10% | 39% | 28% |
| Corporate communication | 48% | 33% | 6% |
| International expansion | 25% | 32% | 30% |
| EDI | 21% | 39% | 25% |
| Facilities management of IT | 13% | 32% | 21% |
| Facilities management of other services | 11% | 24% | 38% |
Q39. Please indicate which of the following best describes your position in the organisation:
| Director Level | 75% |
|---|---|
| Senior management | 16% |
| Middle management | 5% |
| Junior/supervisory management | 1% |
| Other | 1% |
| No response | 2% |
Q40. Please indicate the level of influence you have on strategic thinking in your organisation:
| Strong | Weak | None | No response | |
|---|---|---|---|---|
| Business | 84% | 12% | 3% | 1% |
| IS/IT strategy | 81% | 15% | 2% | 2% |